Please find below a summary of the valuation section of our latest Quarterly Global Asset Allocation. For a full update of our standard valuation models covering a range of asset classes and geographies, please see the full piece HERE. The implications of these valuation models will be assessed in the final published front section of our quarterly publication (due out later this month). This publication is available to private investors as part of our package 'The Investor, or for institutional clients please get in touch at info@longvieweconomics.com.
Equities – Cheap Again
“De-risking” is the buzzword du jour on Wall Street, where hedge funds and their ilk are cutting positions, selling stocks and covering shorts. So-called degrossing activity in U.S. single stocks has climbed to the highest in a year, according to prime-broker data from Goldman Sachs Group Inc.
Source: Bloomberg news, 8th March 2022, LINK to article
Markets are obsessively focussed at this point on the Russian-Ukrainian conflict. Its impact on commodity prices and the associated SELL-off in equities, and other risk assets, has been dramatic. Not surprisingly ‘de-risking’ of portfolios has followed as investors have reacted to the changing situation (see quote above).
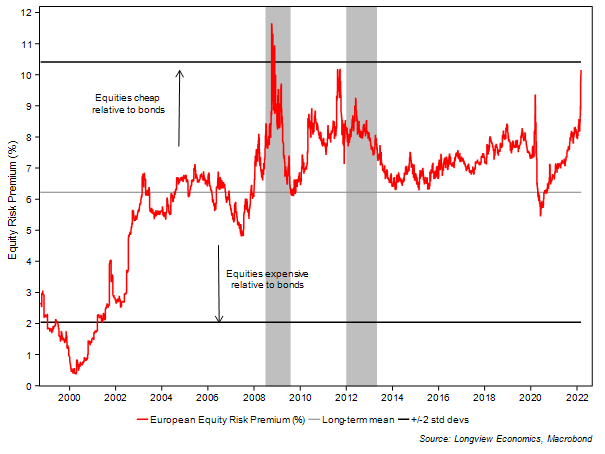
Fig 9: European Equity Risk Premium (earnings yield less real bond yield)
In various recent publications we have outlined the high levels of fears currently priced into these markets (and associated energy price risks). Key Longview market timing models, though, now have some of their strongest BUY signals of the past decade. Equally various commodity prices are up double, or even triple, digit percentages in only a few months (albeit many were off sharply yesterday). Whilst the conflict is ongoing, the risk of energy sanctions (and an associated further leg lower in equities) remains. The positioning of the models, though, highlights that this is likely the BUYing opportunity of 2022.
That message, importantly, is reinforced by the shift in equity market valuations over recent months. Whilst the market has been distracted by the conflict, equities have become notably attractive relative to certain other asset classes. Fig 9 above shows the equity risk premium for European equities. Rather than using a dividend discount model (which requires multiple assumptions about growth rates etc), we infer the ERP by deducting the real bond yield from the stock market’s earnings yield (EY). The maths behind that assumption is laid out in a 2004 research publication (see structural Asset Allocation Research no. 2, June 2004: “EY – a Real Ratio”, available on request).
The European stock market is now therefore offering as much value (relative to the bond market) as it was during the depths of the Euro crisis (fig 9). Real bond yields (RBY) have moved sharply lower since mid-February (as market participants have paid up for inflation protection). Equities have also, of course, fallen (=> higher EY). As such, the ERP (which measures the gap between EY & RBY) has widened significantly (currently ~10%).
Fig 9i: European (STOXX 600) PE ratio relative to US (S&P 500)
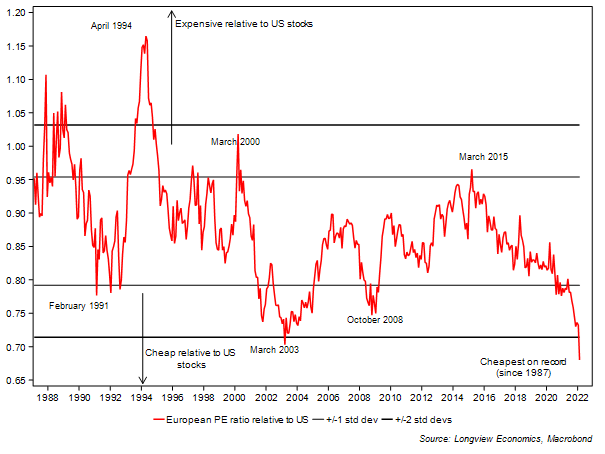
The marked underperformance of European equities over the past 1 – 2 weeks has also further enhanced their valuation discount relative to US equities. Fig 9i shows the relative forward consensus PE ratios of the two key markets. Europe, on this measure, is now the cheapest it has been on record (i.e. data history starts in 1987).
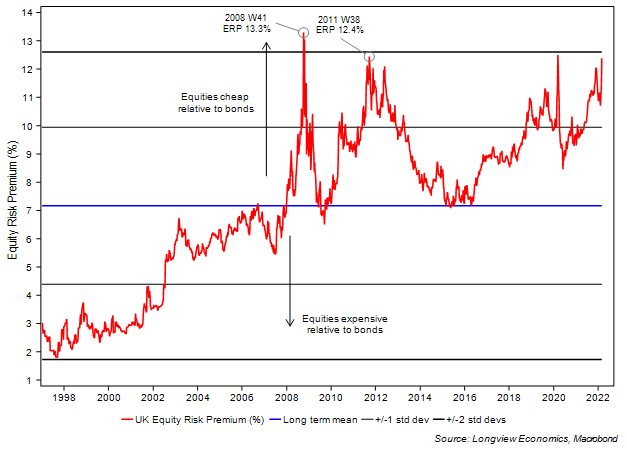
In the UK the situation is similar. Relative to US equities, UK markets have been cheap for a while. Against UK government bonds (real yields), the UK equity market is now also, like the European one, offering close to a record risk premium (fig 9ii).
Fig 9ii: UK Equity Risk Premium (earnings yield less real bond yield)
Even in the US markets (which remain somewhat expensive on stand-alone valuation metrics – see below), value for equities has appeared when measured against other asset classes (i.e. using relative valuation measures).
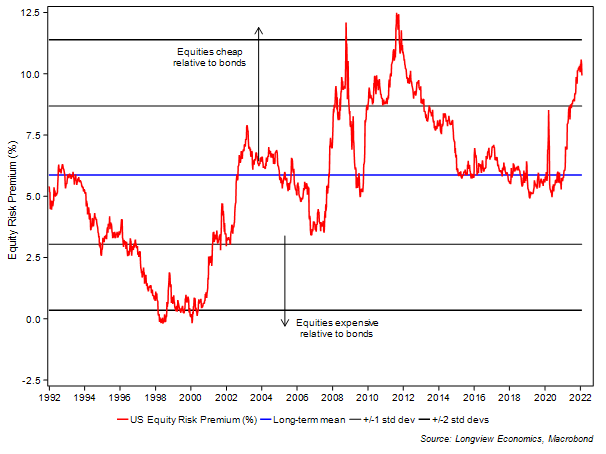
Fig 9iii below is a US equity risk premium, which looks at US equities relative to real cash rates (i.e. fed funds less inflation). Not surprisingly, given such high current inflation rates, equities have reached almost record attractive levels (relative to inflation adjusted cash rates). High current inflation rates, naturally, decrease the attractiveness of holding cash – and therefore reinforce the relative attractiveness of equities (given that companies, which generate the price increases, hold some natural ‘inflation hedge’ qualities). The situation is similar if we use inflation adjusted one year government bond yields. We do that to capture some of the future rate hikes which are already priced into the curve. Even using these higher yields, equities remain attractive on a relative basis (fig 9iv).
Fig 9iii: US Equity Risk Premium (earnings yield less real cash rates)
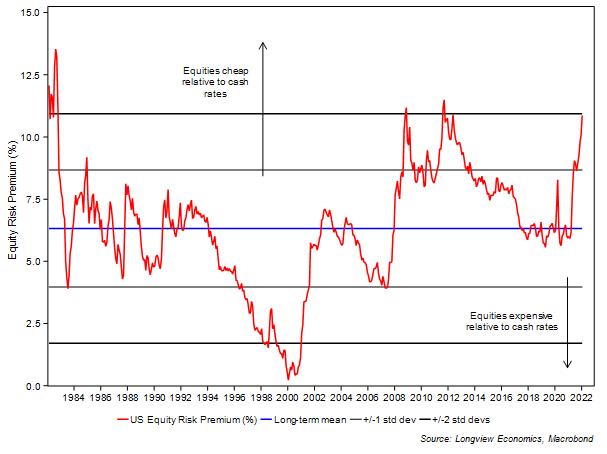
Fig 9iv: US Equity Risk Premium (earnings yield less real 1y bond yield)
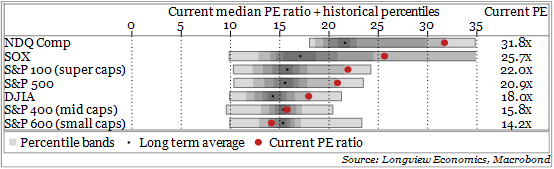
Stand-alone valuation metrics: Other measures of US equity market valuation, which use stand-alone valuation models (rather than relative ones), carry a different message. The table below shows the history of forward median PE ratios for various key US equity indices (using data back to 1999). The red dots are the current median PERs. The grey bands are ‘decile’ bands, while the ‘*’ are the long-term averages.
Of note, the PERs of most of the key US equity indices are still notably above historical averages and often in the top 1 or 2 deciles. The S&P600 (small caps) is the exception and the only index with a below average median PE ratio.
Table 9v: Median PE ratios (based on rolling 12m forward consensus EPS) shown with current, average & decile ranges (various US indices)
Other Valuation Observations
Other key points/extremes on valuation metrics of note include the following:
Fig 9vi: PE relative (India vs. China) shown against relative performance of their stock markets
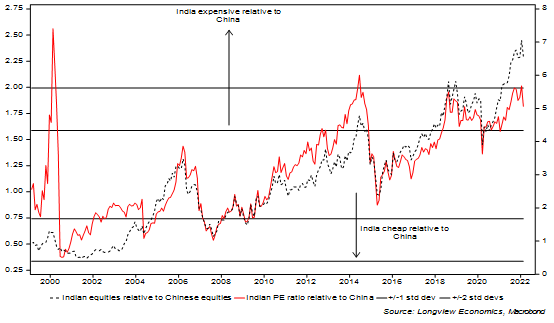
- Indian equities are expensive relative to Chinese equities. That’s the message of the relative forward PER of those two markets. As fig 9vi shows, that relative valuation has just reached +2 standard deviations (i.e. India expensive relative to China). On the past three occasions that has occurred (including 2018/19 when the ratio was just shy of +2 standard deviations), Indian equities have suffered sustained underperformance over several quarters.
- Commodities are cheap relative to equities: Whilst commodities have rallied sharply, especially in recent weeks, on a relative price chart* they remain attractive relative to equities (fig 9vii). If our analysis is correct and we have recently started a new ‘commodity super cycle’, then we would anticipate a spike in coming years in the relative price of commodities vs. equities (equivalent to the spikes of 1974, early 1980s, 1990 gulf war and GFC – see fig 9vii). Naturally that can occur via both sharply lower equities and price spikes in commodities. NB Most commodity super cycles last 10 years or longer.
FIG 9vii: Commodities vs. equities (relative price*)
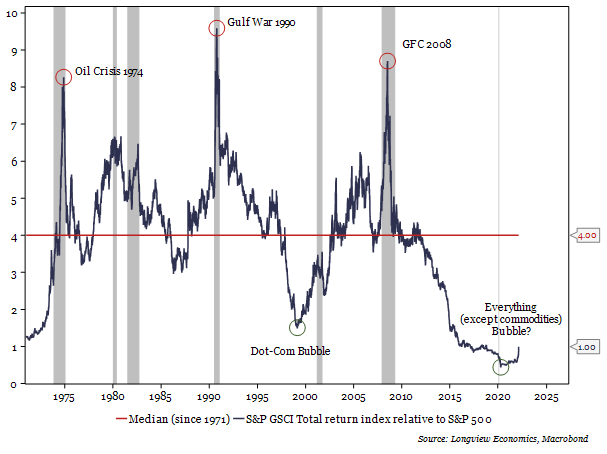 *The relative price chart is a proxy for relative valuation (albeit a poor one). It’s calculated using the S&P500 GSCI total return commodities index vs. S&P500.
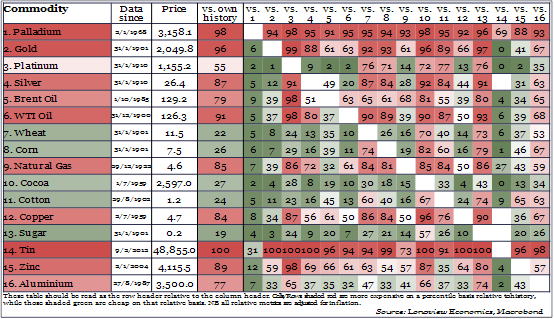
- Various commodities are expensive on a stand-alone basis: Despite that cheapness relative to equities, on a stand-alone basis (when deflated by CPI), various commodities are expensive relative to their own price history. Table 9viii shows the current price deflated by consumer price inflation and then placed into percentiles using the commodities own price history (and then also relative to all other commodities). On this approach, most of the precious metals, the base metals and the energy commodities are close to their highest ‘inflation adjusted’ prices on record (albeit that doesn’t preclude them from making new all-time highs). Agricultural commodities are the key sub-group which remain notably below their record highs.
Table 9viii: Commodity Heatmap (all commodity prices deflated by CPI)
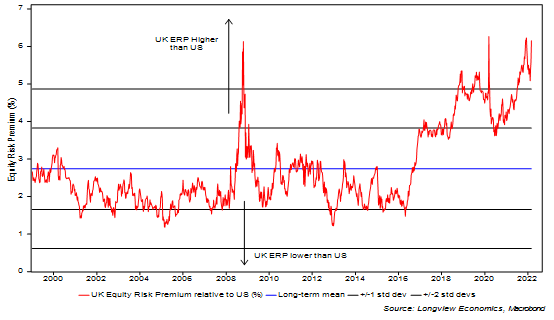
- Finally, UK equities are at notably cheap levels relative to US equities using both forward PERs and equity risk premiums (fig 9ix).
Fig 9ix: UK ERP relative to US (pp)