The Netherlands imposed a three-week partial lockdown and are planning to ban the unvaccinated from major entertainment venues; Slovakia announced a “lockdown for the unvaccinated”, while Greece has barred the unvaccinated from accessing restaurants, cinemas, museums, and gyms.
German officials haven’t ruled out another lockdown: The German health minister has warned that by the end of winter “pretty much everyone in Germany will be vaccinated, recovered or dead" (Jens Spahn, 22nd Nov).
The reintroduction of lockdown measures has sparked a strong reaction. Peaceful demonstrations involving thousands of protestors were seen in Austria, Italy, Switzerland, Denmark, Croatia, and France. In Belgium, tens of thousands marched in Brussels with protests descending into rioting. Likewise, violent clashes in the Netherlands left several people reportedly shot after the police fired into the crowd.
Fig 1: German infections, hospitalisations and deaths (per mn)
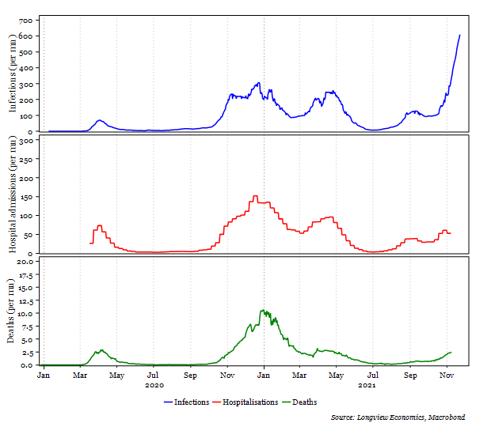 With the crisis deepening, globally investors are increasingly focussed on the health situation in Europe. In particular, the key question is whether the fast-rising infection, hospitalisation and death rates will spread across Europe, or whether they will remain contained.
In our view, there are several major factors that are likely to be driving this recent surge in infections:
- Waning vaccination protection: Last week we demonstrated that one of the major factors behind rising infection levels in Europe is waning vaccination protection (see HERE). Critically, that waning protection is primarily affecting older populations
Since august, infections among over 60s as a share of total new infections in Germany has grown from 7% to 18%. More significantly, the over 60s’ share of new hospitalisations has grown from 34% to 62%* (fig 1a).
Fig 1a: German infections and hospitalisations by age group (4 weeks aggregated)
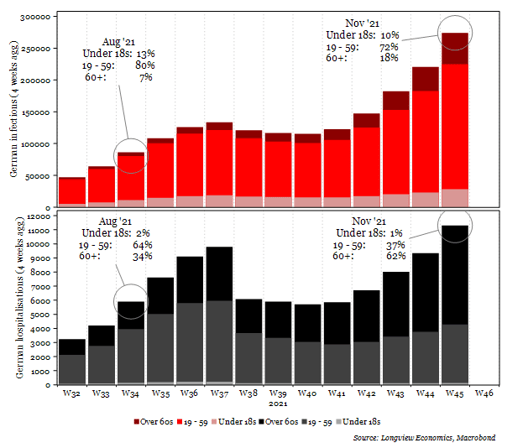
* For comparison, under 18s consistently make up just 1% – 2% of new hospitalisations.
That waning vaccine effectiveness has been confirmed by analysis from the Robert Koch Institute (see HERE). Effectiveness against infection among older age groups has fallen from a high of 84% in June to 64% more recently. Effectiveness against death has fallen from 91% to 82%.
Significantly, though, and as we highlight below, while unvaccinated patients account for a decreasing proportion of overall infections and hospitalisations, the number of infections/hospitalisations among the unvaccinated is still increasing in Germany (as well as in Denmark and the Netherlands, see last week’s piece HERE for detail).
- Vaccination rates are relatively low in many of the European countries imposing new restrictions. In Germany, only 67% of the total population is fully vaccinated. Likewise, Austria has vaccinated 65%, Norway 69%, and Denmark, Belgium and the Netherlands have all vaccinated ~75%. Only Spain has vaccinated over 80% of its population (and has one of the lowest rate of hospitalisations in Europe currently, see fig 1i). Unvaccinated people unsurprisingly account for a significant proportion of new infections and hospitalisations. In Germany and Denmark, for example, the unvaccinated currently account for 57% and 47% of new infections respectively (albeit that has fallen significantly in recent weeks as waning vaccine efficacy has resulted in more vaccinated people becoming infected, e.g. see fig 1b).
Fig 1b: German infections in vaccinated vs. unvaccinated people1 (4 weeks aggregated)
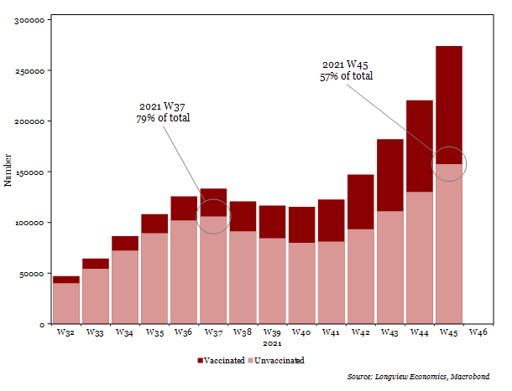
1 Among those whose vaccination status is known (it is likely that the actual proportion of people infected & fully vaccinated is smaller, albeit that does not deter from the argument that waning vaccination efficiency is leading to an increase in infections). In the Netherlands, for example, the vaccination status is known for ~80% of people being infected (see table 1).
- Slow booster rollout. As we showed for Israel recently (see HERE), booster shots were effective at reducing hospitalisations among older populations. In comparison to Israel (which has now boosted 44% of its population), boosters have only been administered to between 7% – 10% of most European countries’ populations (fig 1c). Austria, though, has sharply accelerated their program in recent weeks, having now boosted a greater share of their population than the US (14% vs. 11%). As such, if other countries follow the example of Austria, a wider reintroduction of lockdown measures may not be necessary to curb rising infections/hospitalisations.
Indeed, that seems to be the case for Israel and the UK. After Israel’s rapid vaccination program in August and September, infections and hospitalisations have returned to low levels (albeit seasonal effects could also have been a factor, see point 4 below). Likewise, in the UK (where 23% of the population has been boosted), infections have yet to reach their previous peak (unlike many other European countries in which infections are making all-time highs, see fig 1h).
Fig 1c: Share of total population* boosted (%)
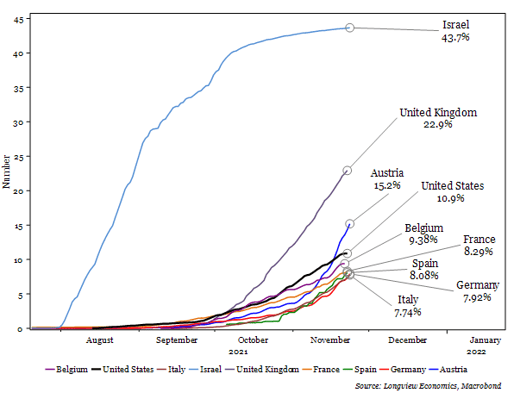
* Includes all age groups.
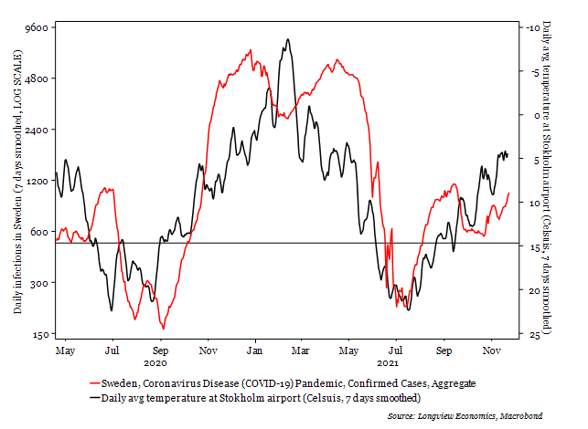
- Climate and seasonality: Added to those factors above, a fourth key factor to consider is weather/climate. Changes in temperature in Sweden, for example, have coincided with the recent waves of infections (fig 1d). Rising infections in late 2020 coincided with the drop in temperatures at the time. That continued until April 2021, when infections began dropping again (just as temperatures rose meaningfully above ~10 degrees). Now, as temperatures have rolled over, infections are back on the rise.
Fig 1d: Daily infections in Sweden (7 days smoothed, LOG SCALE) vs. average daily temperatures in Stockholm (Celsius, 7 days smoothed, scale INVERTED)
 Changes in temperature don’t always coincide with rising/falling infections. In the UK for example, daily infections fell to very low levels in Feb 2021 despite consistently low temperatures and spiked in July despite generally higher temperatures (likely due to variations in lockdown measures, testing rates, etc.). Overall, though, a consistent pattern can be seen in most other major European countries. Infections in Germany, the Netherlands, and Belgium (among others) all turned higher as temperatures begin falling (e.g. see figs 1k – 1n below).
As such, it’s clear that numerous factors can influence the rate of infections over time, and that even predictable factors (such as the climate) remain a concern. With that, as infections turn higher across Europe, it’s likely that hospitalisations and deaths will follow given fading vaccine immunity, slow booster rollouts and colder temperatures. Currently, even though infections have reached new highs in several European countries (fig 1h), deaths and hospitalisations remain much lower than previous peaks due to vaccine protection (e.g. see figs 1e – 1g below). It appears, though, that without a rapid ramp up in boosters, infections, hospitalisations, and deaths will continue to rise, and stricter lockdown mandates will be further implemented across Europe in the lead up to the holidays.
Fig 1e: Belgium infections, hospitalisations and deaths (per mn)
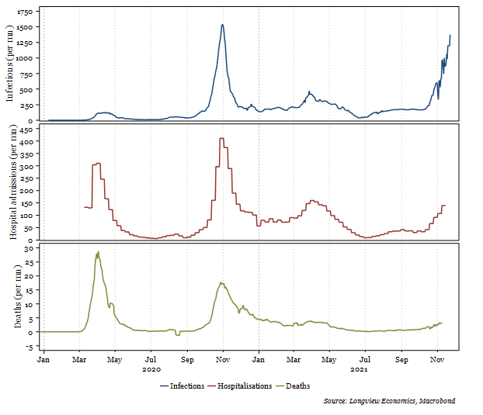
Fig 1f: Norwegian infections, hospitalisations and deaths (per mn)
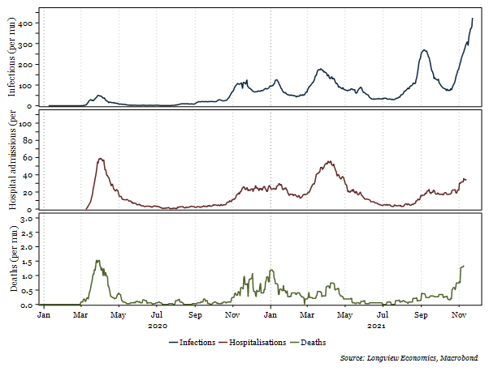
Fig 1g: Austrian infections, hospitalisations and deaths (per mn)
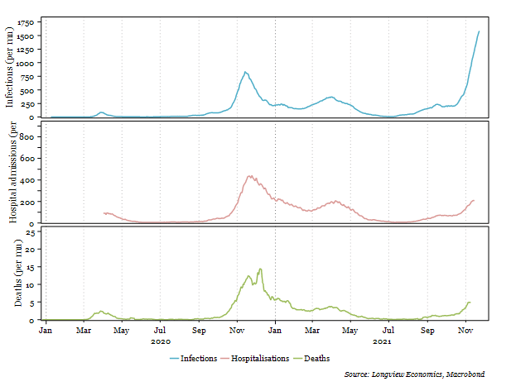
Fig 1h: Europe daily infections (% of all-time high)
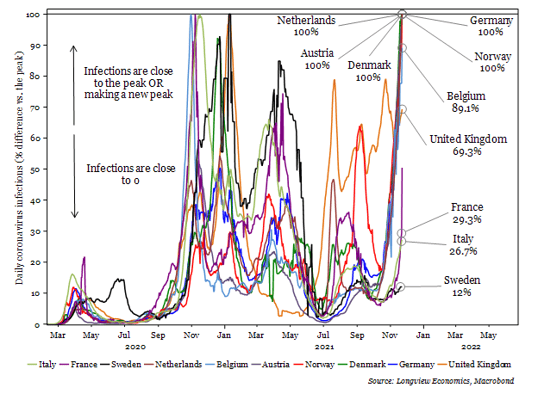
Fig 1i: Europe daily hospitalisations (% of all-time high)
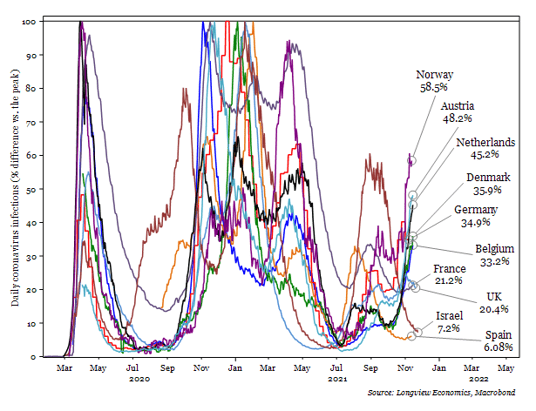
Fig 1j: Europe daily deaths (% of all-time high)
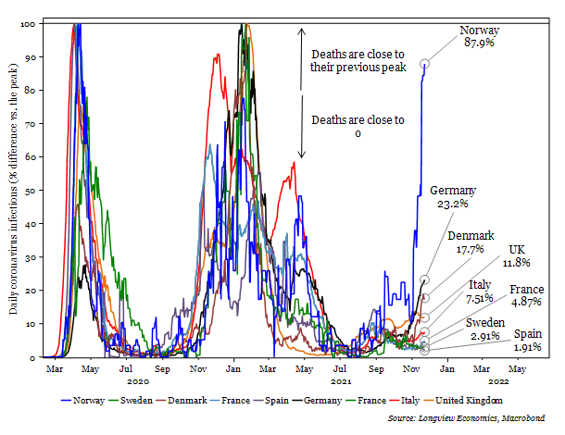
Fig 1k: Daily infections in the UK (7 days smoothed) vs. average daily temperature in London (Celsius, 7 days smoothed, scale INVERTED)
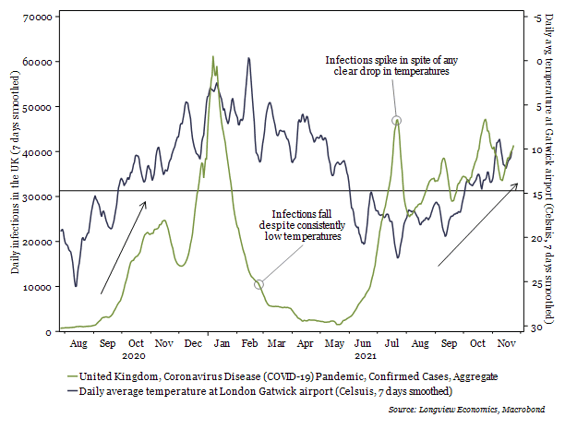
Fig 1l: Daily infections in Germany (7 days smoothed) vs. average daily temperature in Berlin (Celsius, 7 days smoothed, scale INVERTED)
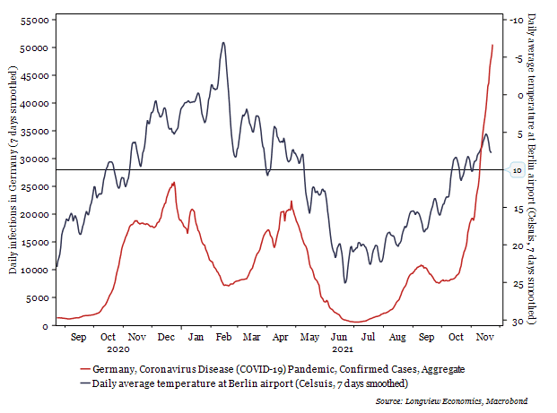
Fig 1m: Daily infections in Netherlands (7 days smoothed) vs. average daily temperature in Amsterdam (Celsius, 7 days smoothed, scale INVERTED)
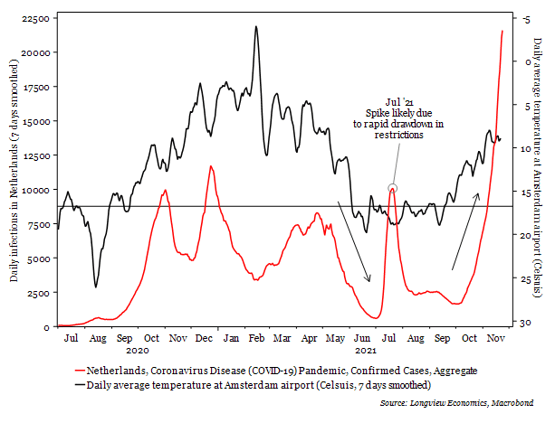
Fig 1n: Daily infections in Belgium (7 days smoothed) vs. average daily temperature in Brussels (Celsius, 7 days smoothed, scale INVERTED)
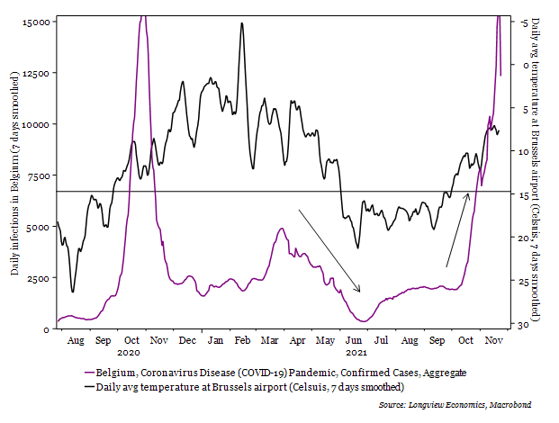
Fig 1p: Lockdown stringency indices, shown for various countries
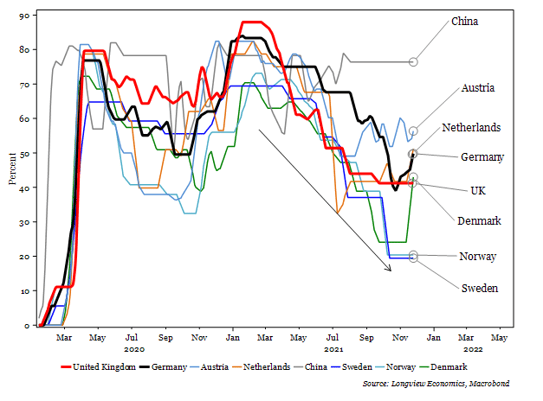
Fig 1q: Share of total population* fully vaccinated (%)
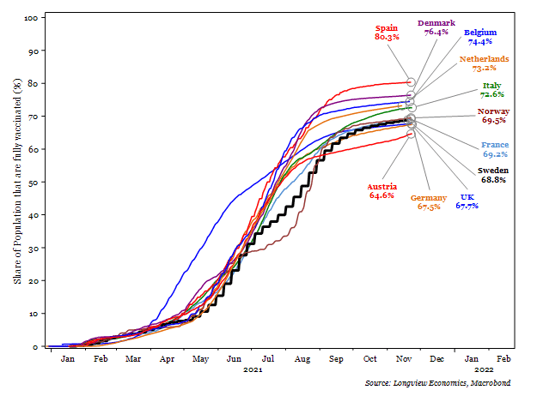
* Includes populations of all age groups.
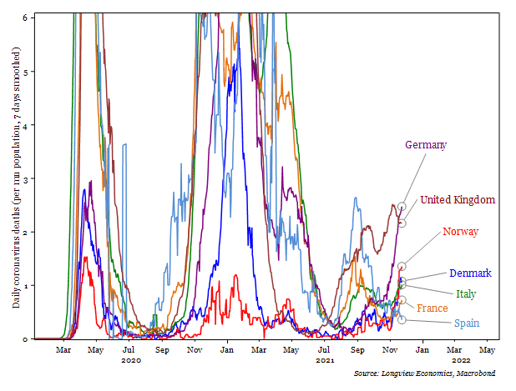
Fig 1r: Europe daily infections (per mn population, 7 days smoothed)
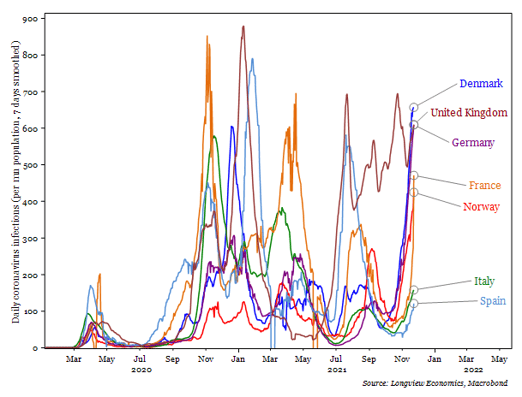
Fig 1s: Europe daily deaths (per mn population, 7 days smoothed)