There seems to be a growing list of reasons to worry about the outlook for equities. In particular, on many metrics, this bull market appears increasingly tired (e.g. see FIG 2) whilst the economic expansion, on some measures, looks increasingly mature and vulnerable.
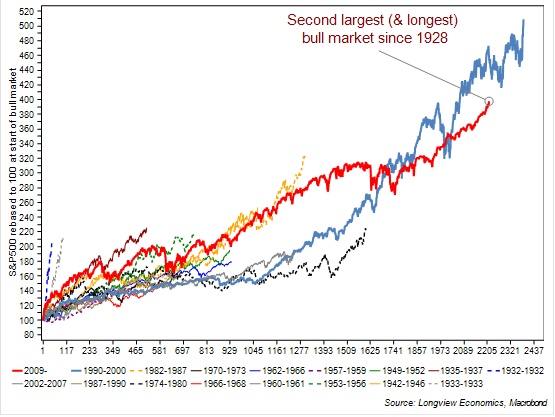
In particular, from an equity market perspective, the US Shiller PER is now back at its highest level since 1929 (with equities only more expensive in the 1990s tech bubble). With that, cash levels in portfolios are already back at tech bubble levels (i.e. their lowest since December 1999, FIG 1). In that respect, market participants appear to be fully (if not overly) committed to equities*. Illustrating that, it’s now been 384 trading days since the S&P500 had a 5% (or greater) pullback. That’s the (joint) 3rd longest winning stretch since 1928.
FIG 1: Portfolio cash levels (%, individual investors, AAII survey)
*FIG1 refers to retail cash levels. Institutional cash levels are also reported to be low.
FIG 2: S&P500 rebased to 100 at the beginning of the cyclical bull market
From a economics perspective, there are also a number of concerns. In particular, the rapid flattening of the yield curve, typical at the latter stages of the cycle, point to the growing risk of a Fed policy mistake. Other concerns include weakness in the US construction sector and other cyclically (and interest rate) sensitive parts of the US economy, e.g. bank lending. We address these (and other issues) HERE, in our latest US macro piece.
Stay OW Risk (in both strategic & tactical portfolios)
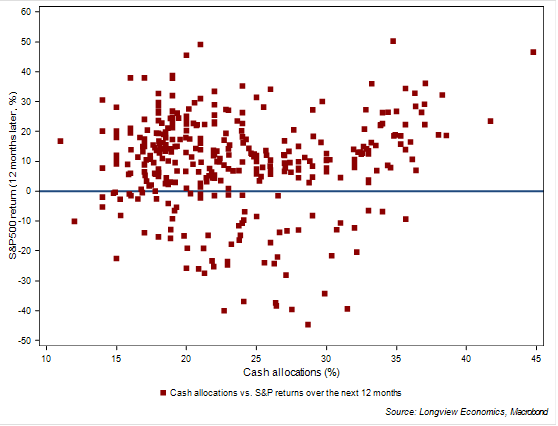
As always in markets, though, and while those concerns carry some merit, the key question is one of timing. In that respect, neither extreme valuations nor ‘low’ cash levels in portfolios hold any investment timing information on either a 12 or even 24 month view (as we show in HERE & in FIG 2a below).
FIG 2a: Cash allocations in portfolios (AAII) vs. S&P500 12 month return (%)
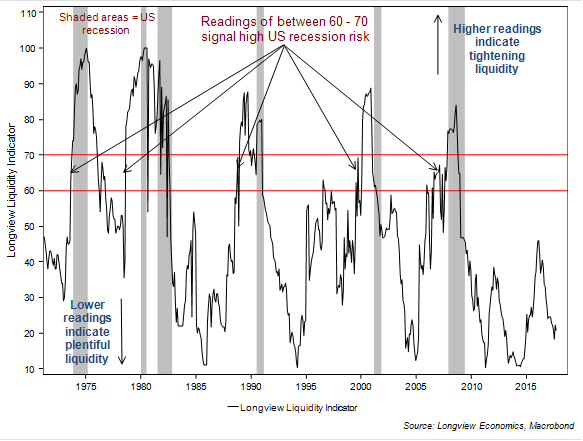
Instead, equities typically continue to trend higher until either monetary policy overtightens, companies retrench – and/or there’s a shock. At this juncture, though, there’s no evidence that money has ‘overtightened’. That’s the message of the Longview Liquidity indicator (which we have recently written about HERE & HERE). It scores and aggregates the signals from 5 key liquidity & monetary indicators which lead the economic cycle. Currently it’s pointing to ample liquidity in markets (and has correctly forecast all of the last 6 US recessions, see FIG 3 below).
FIG 3: Longview Liquidity Indicator – shown with US recessions
Coupled with that monetary backdrop, it’s clear that the US corporate sector is in good health (in a cyclical sense). Profit growth has picked up, margins have improved and the cash flow position of companies is in good shape (evidenced by a small corporate sector financing gap – see HERE for detail). The risk of corporate sector re-trenching is therefore low at this juncture. Linked to that, other key measures of corporate sector risk are also low (i.e. equity market volatility). As such, this low volatility environment is underpinned by fundamental factors (as it was in 1995 & 2005, see HERE for detail). In the absence of a shock (e.g. an oil price spike or a war) this economic expansion should therefore persist and underpin an ongoing bull market in equities (see HERE for detail).
There’s also a case for staying OW equities in tactical portfolios (i.e. with a 1 – 4 month time frame). In addition to those factors laid out above, a number of medium term positioning indicators are on (or close to) BUY levels. At this juncture, though, we continue to retain modest position sizes (with the view to increasing tactical equity exposure on weakness, if forthcoming – see HERE for detail).
Favour US equities relative to EZ & EM (in strategic portfolios)
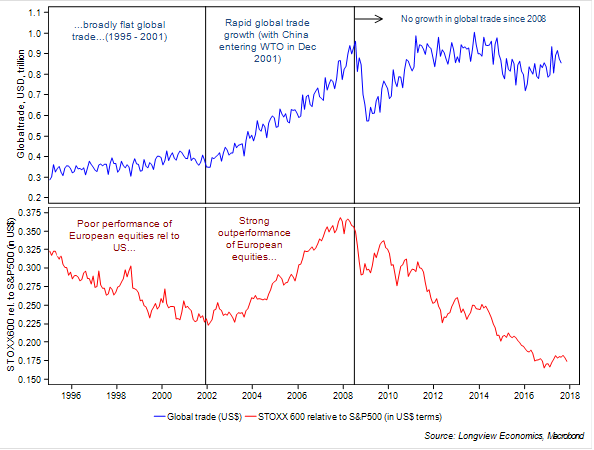
Despite strong (and growing) optimism towards Europe in the past 12 – 18 months, its equity market performance was relatively poor in 2H ’17 (and, indeed, has been relatively poor for most of this economic cycle). That theme of poor relative performance is likely to continue. In particular, Europe’s economy, earnings and equity market are, primarily, a play on global trade growth. As such, phases of strong Euro zone equity market relative outperformance typically coincide with rapid global trade growth (e.g. the last economic cycle). Europe then tends to underperform in phases of weak/falling global trade growth (see FIG 4 below). Given the outlook for China (and other key EM economies), trade growth is likely to remain under pressure (see HERE for a detailed analysis of China’s economy).
Fig 4: European equities relative to US vs. global trade (billion US$)
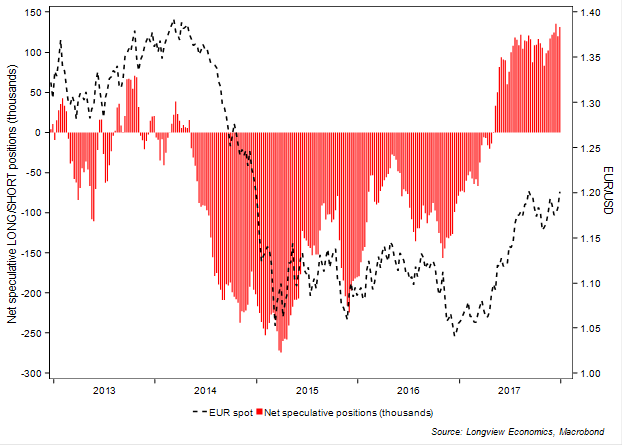
It’s worth noting, particularly for unhedged investors, that the LONG euro trade is particularly crowded, with net speculative LONG positions in the euro close to multi-year highs (FIG 5). As Europe’s growth rate softens from currently elevated levels (see HERE) then that will probably trigger an unwinding of those positions in 2018.
FIG 5: EUR-USD vs. net speculative LONG/SHORT positions
…and stay UW emerging markets: At its heart, EM equity direction is primarily driven by the evolution of Fed policy (and, as a subset of that, US inflation – see HERE for detail). In that respect, strong EM equity gains last year were primarily a result of i) a sharp fall in US inflation readings; ii) a pushing back of the timing of Fed hikes; and iii) a phase of US$ weakness, see FIG 6.
Fig 6: EM MSCI equity index (in US$ & local currency) vs. Broad US$ index
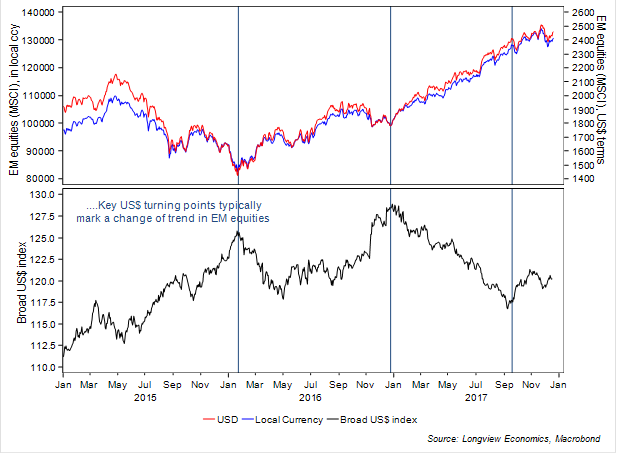
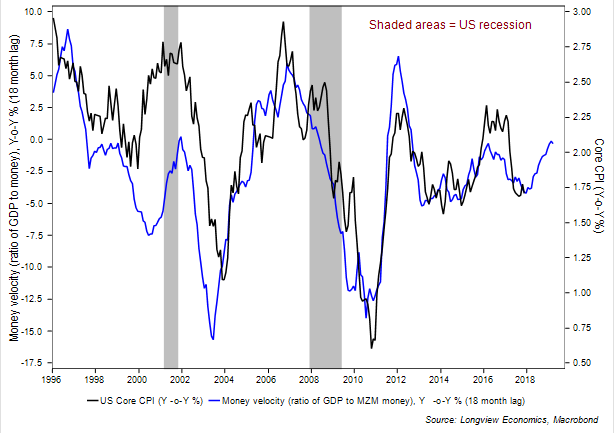
That US dollar weakness was, no doubt, fuelled by a significant unwinding of net speculative LONG positions (from relatively extreme/high levels). Dollar positioning, though, is now net SHORT (i.e. against most other major currencies). The key risk to emerging markets is that those 2017 dynamics reverse this year. In particular, leading indicators point to a re-acceleration of inflation readings over the next 12 months (FIG 7). If forthcoming, the US rates market should continue to bring forward the timing of Fed hikes (i.e. so that it’s more closely aligned with the Fed ‘dots’).
FIG 7: US money velocity (Y-o-Y, % - lagged by 18 months) vs. Core CPI inflation (Y-o-Y %)
Move OW Bonds
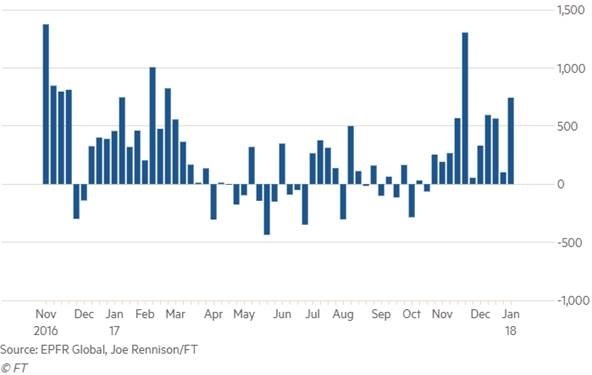
While higher inflation has arguably not yet been fully priced by the rates market, other indicators have a more convincing message. Breakeven inflation rates, for example, have picked-up sharply (albeit primarily driven by oil price strength) while bond (and bond fund) positioning has become increasingly bearish (e.g. see FIGs 8 & 9).
FIG 8: US 5-year Treasury note futures vs. net speculative LONG/SHORT positions
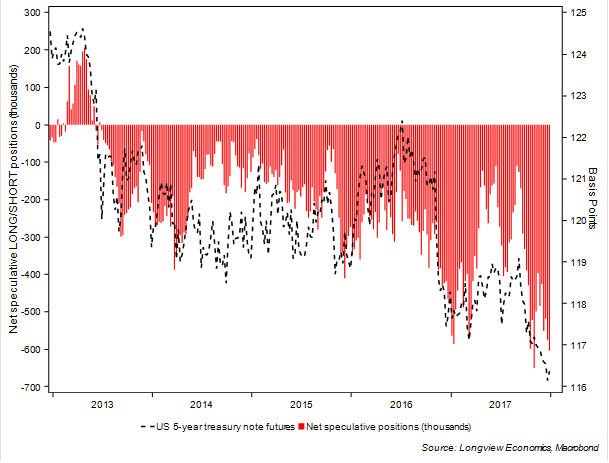
FIG 9: Global inflation protected bond fund flows (US$, million)
In part that reflects the widely held view that, as inflation picks up, and as the Fed tightens, medium to long term US Treasury yields will rise (e.g. see recent BofAML fund manager surveys which also suggest that SHORT bond positioning has become increasingly crowded).
As per the 2003 – 2006 experience, though, the Fed (still) appears to have lost control of the medium to long end of the curve. Indeed, since Fed tightening began (arguably in 2014), US 10 year bond yields are flat/down. Primarily that reflects the structurally weak state of the US economy (which has deteriorated since 2003 – 2005, see HERE for detail). Continued yield curve flattening, with 10 year bond yields moving lower (or, at best, sideways), is therefore likely.
Have a great weekend
Kind regards,
Longview