Please find a summary of our latest SHORT VIEW - for the full piece, or to start a free trial of this, or any our other products, please get in touch: info@longvieweconomics.com
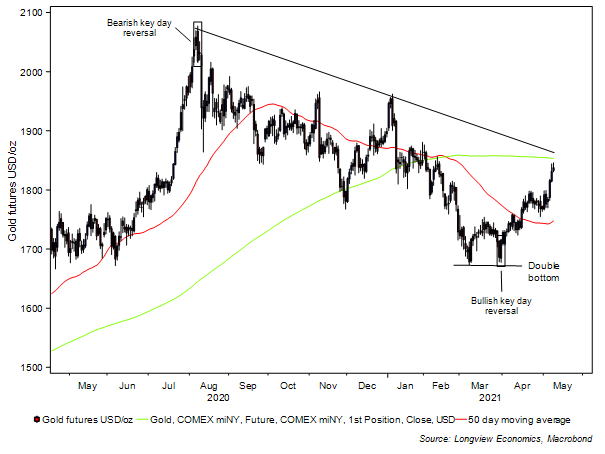
Price action in gold has been particularly strong in recent months: Since its ‘double bottom’ formation and bullish key day reversal in Mar-Apr, the price has rallied by over 10% and has broken above its 50-day moving average (FIG A).
While all of that has been encouraging for the bulls, the gold price is now poised. It’s close to two key technical resistance levels: Its 200 day moving average and the top of its recent downtrend channel. The key question, therefore, is: What’s next? Will the downtrend now resume or will upside momentum win out with gold breaking out above those key levels, and trend higher over coming weeks/months?
FIG A: Gold price (US$/oz), shown with 50 & 90 day moving averages
Harry examines the key reasons why we think it’s the latter, namely:
-
The Fed continues to debase the dollar (as monetary policy remains easy).
-
Real bond yields and implied Fed Funds rates are likely to remain subdued (or potentially fall further)
-
Sentiment and Market positioning are not excessive (and indeed, at their least Bullish since early 2019)
Learn more about the Short View