Lately at Longview we have been updating our quarterly asset allocation analysis and views. The research on the US, EZ, and Chinese macroeconomic outlooks have already been published and are available on request (Research@LongviewEconomics.com). The front section, containing the explicit 6 - 24 month investment recommendations will be published later this week.
The extract below is from the valuation section of the quarterly analysis, focusing on just how expensive asset prices are globally. The full piece is available HERE.
Global Valuations: Everything is Expensive
Following the fastest S&P500 bear market on record in March, the response from policymakers has been unprecedented, causing markets to rally aggressively. The S&P500 is up 42% from its March lows, despite earnings estimates being revised lower. This has resulted in the most expensive US equity market valuation since the dotcom bubble (21.4x forward earnings).
The bulls argue that this is justified by ongoing central bank largesse. As we have illustrated previously with our liquidity model, the primary driver of the PE rerating is, indeed, plentiful liquidity. The bulls also argue that ‘there is no alternative’ to equities, i.e. ‘TINA’, and that market participants are looking through 2020 earnings, and thinking about the market on 2021 or even 2022’s expected EPS.
Fig 1: Share of global equity markets with a top quartile PE ratio* vs. S&P500
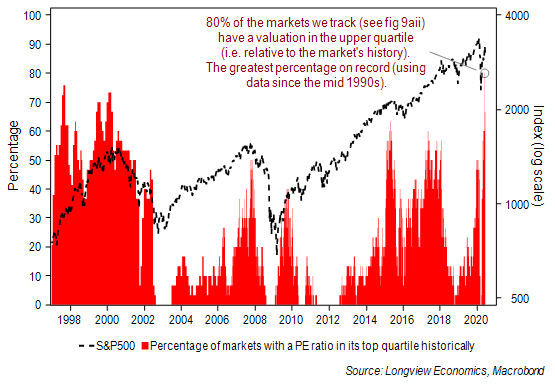
*Using 12 month rolling forward consensus EPS for 30 country/regional equity markets.
On the surface that argument is attractive. Cash rates are at/close to zero, or even negative, while real yields are at their lowest since 2013 (i.e. the last period of Fed QE).
On a closer inspection, however, the ‘TINA’ argument isn’t strong: Across a range of various risk premia, comparing equities to other asset classes, US equities are typically in line with, or even, below long term averages – that is, equities aren’t especially attractive on relative valuation metrics.
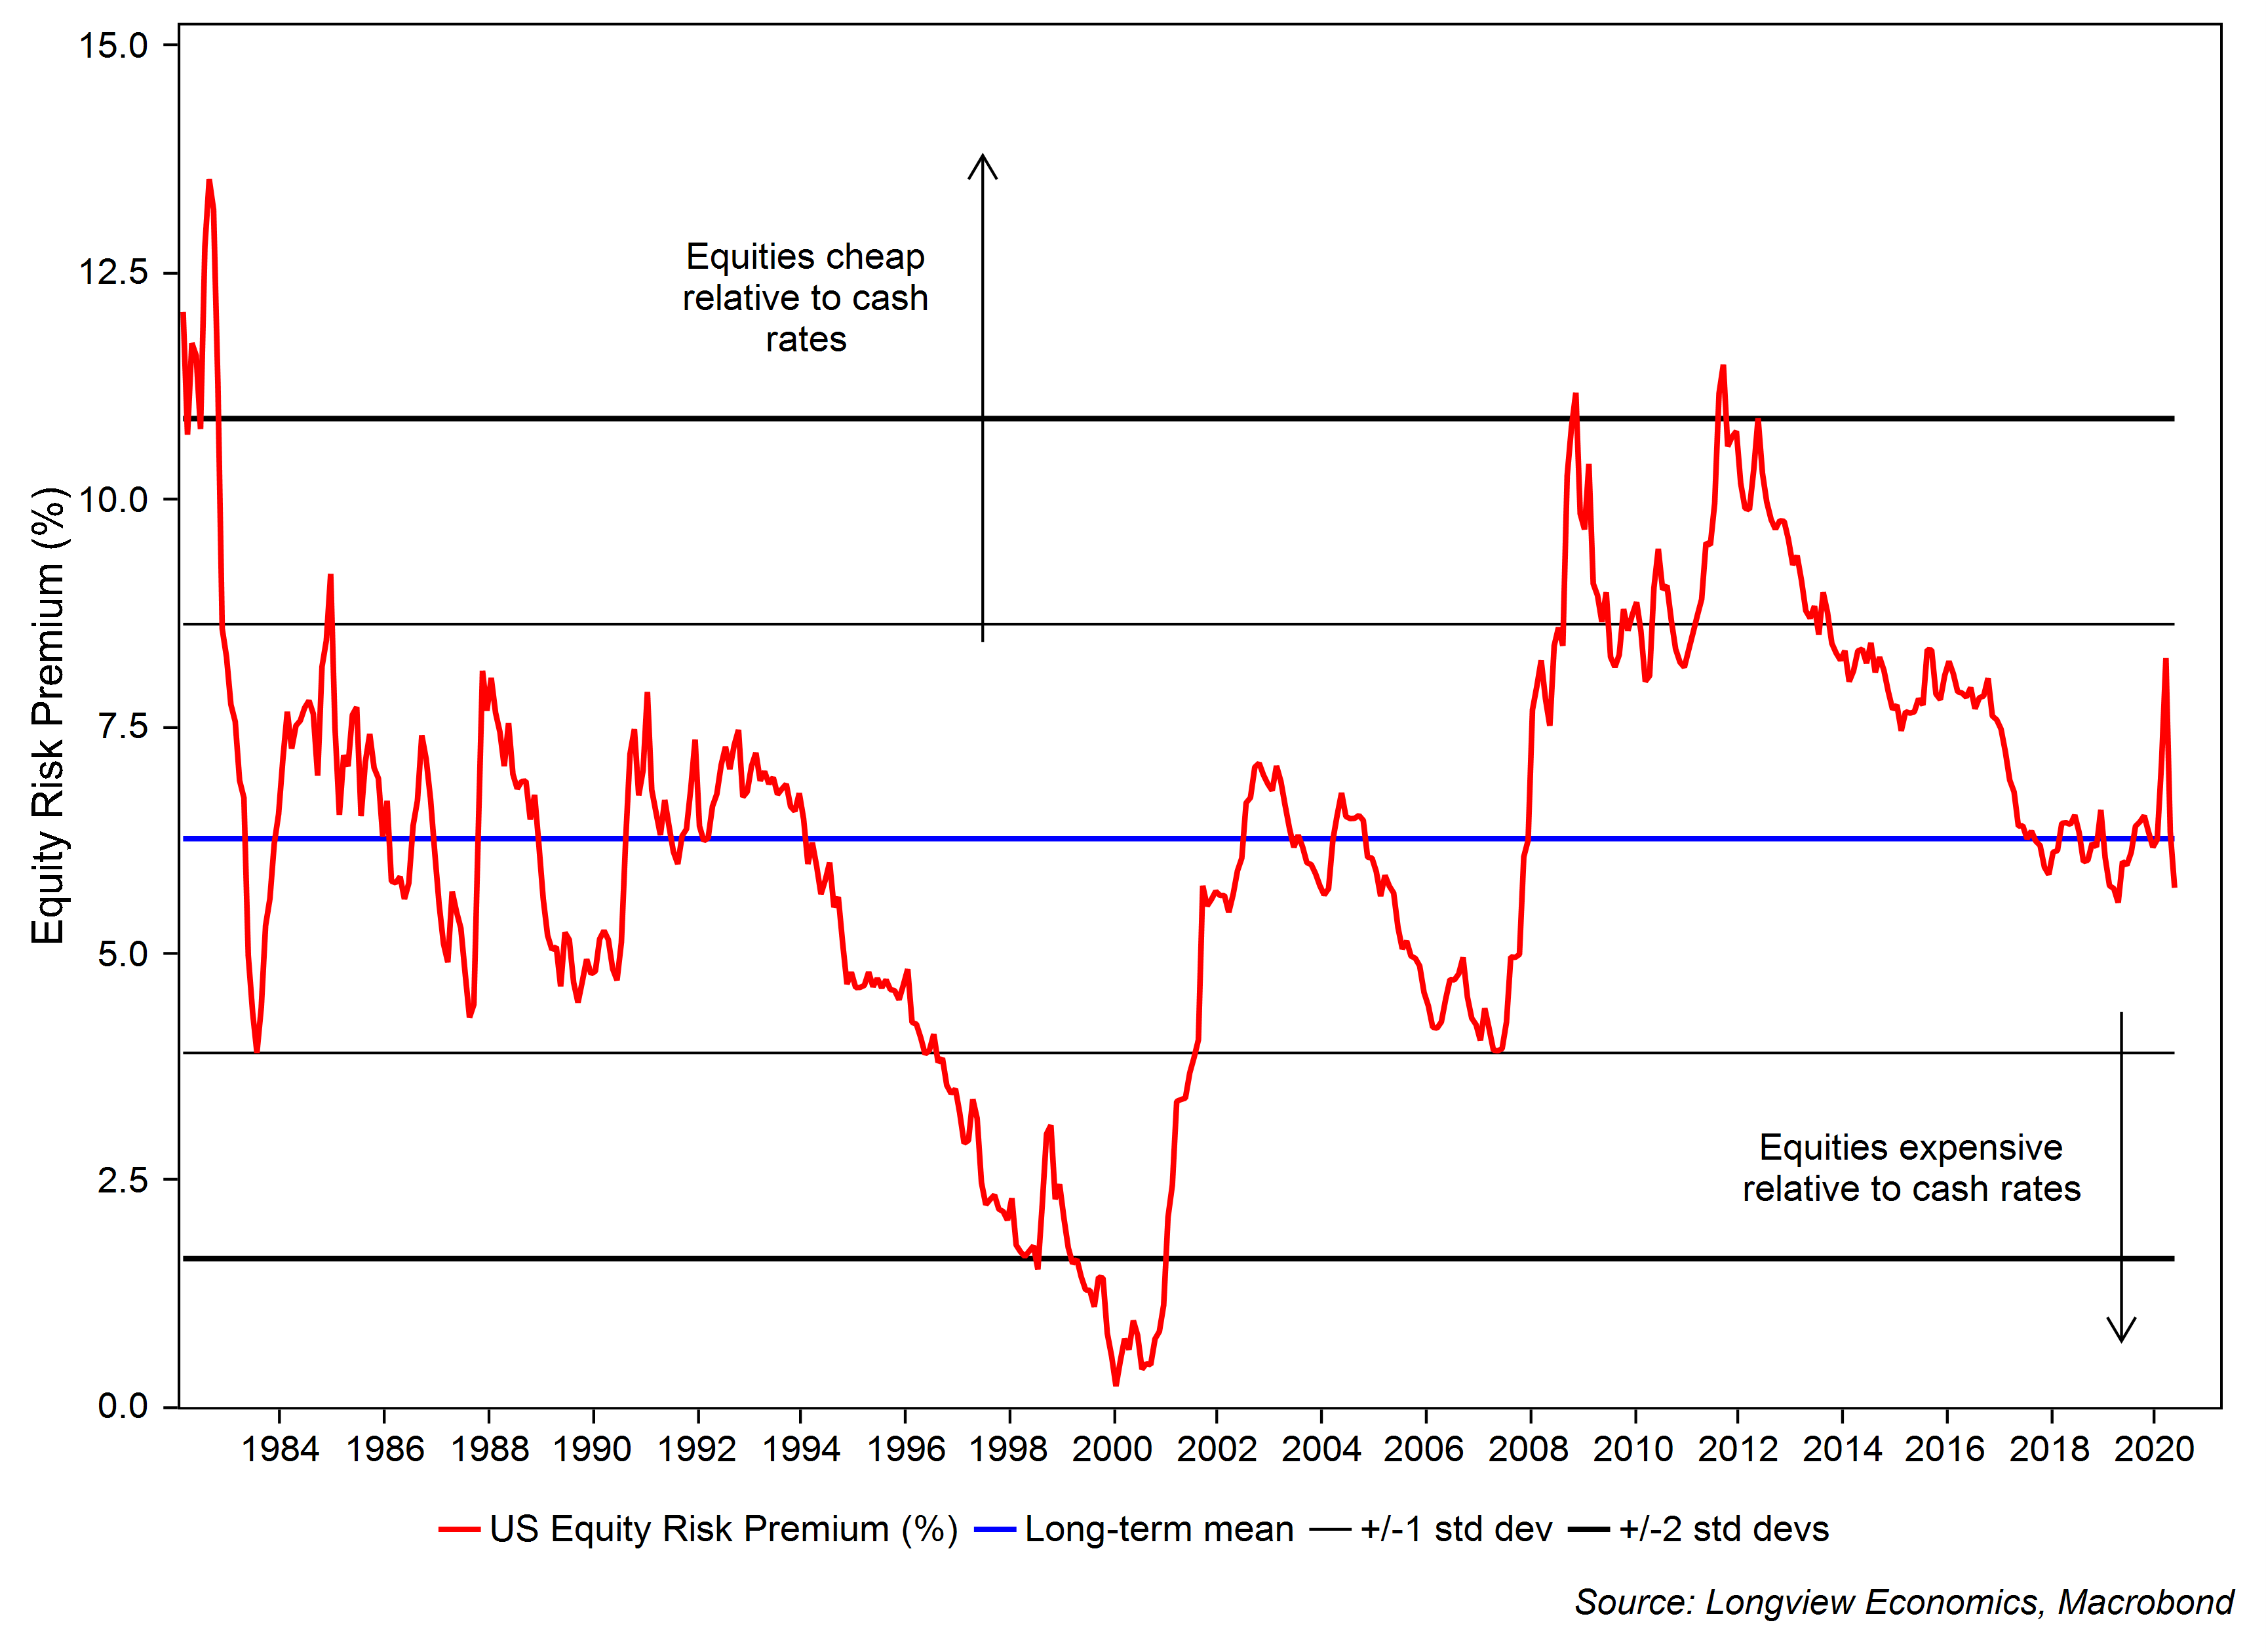
Measuring the S&P500’s risk premium using real yields, for example, shows that it’s at its lowest since 2009, and below its historical average; measured relative to real cash rates, the ERP is also below its long term mean (fig 2 below); against investment grade and high yield corporate bonds, the message is broadly similar. In Europe, the ERP has also fallen sharply and is now at its lowest since the GFC.
Fig 2: US Equity Risk Premium (earnings yield less real cash rates)
In our quarterly valuation analysis we look further into the detail to assess how expensive equities are across the different levels of market prices globally, i.e. at an index, sector, and single stock level. The full piece is available HERE.