As part of our new 'Quant Monthly' product we are publishing various appendices which analyse the earnings and valuation metrics key country equity markets (in part I) and US sectors (in part II) from various angles. These are designed to support the thematic work that we carry out in the front section of this publication. The appendices are available for download for FREE and can be accessed by clicking the hyperlinks above.
The third Quant Monthly was published in two parts over the course of the past week:
- 12th May 2022 (No. 3: "What Happens When TINA Unwinds? a.k.a. Where is the Speculative Excess?") &
- 19th May 2022 (No. 3 (part II): "What Happens When TINA Unwinds: Some Sector Thoughts”)
WHAT HAPPENS WHEN TINA UNWINDS?
TINA (There Is No Alternative), characterised by central banks creating new money and buying up parts of the pool of globally available financial assets, contributed to higher valuations in the ‘fashionable’ areas of the global equity market. Especially since the end of the GFC, cheap and plentiful liquidity has been a key and overarching theme in markets. Record low borrowing rates, as well as record levels of money creation have fuelled an incredible appreciation in asset prices over the past thirteen years. Money has flowed into all asset classes, at all ends of the risk spectrum.
In our latest Quant Monthly publication, quantitative analyst Andrew Sluman looks to measure excess in the US markets built up since 2009.
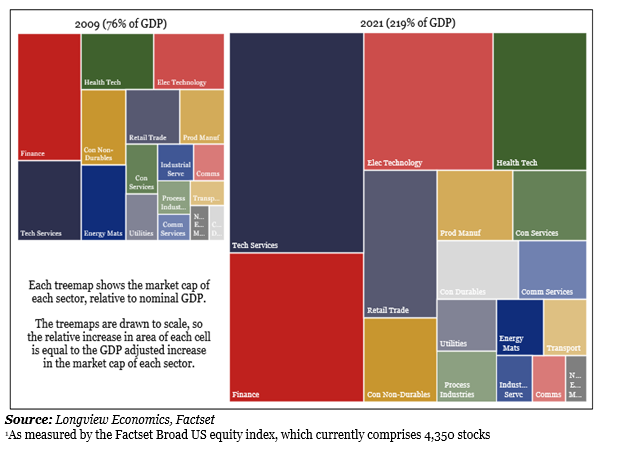
In 2009, the broad-US equity market cap stood at $11 trillion (76% of GDP). By the end of 2021, market cap had more than quadrupled to $53 trillion (219% of GDP). That’s an annual (compound) growth rate of over 14%. In Fig 1 below, we illustrate the size of that increase (even when adjusted by GDP). In absolute terms, the largest three sectors, not surprisingly, have seen the biggest increase in market cap (i.e. tech services, finance and electronic technology). In growth rate terms, consumer durables, which includes the auto sector (i.e. Tesla), has shown the fastest increase – growing by 25% per annum over the economic expansion.
Fig 1: Broad US1 market cap by sector, 2009 & 2021, GDP adjusted & to scale
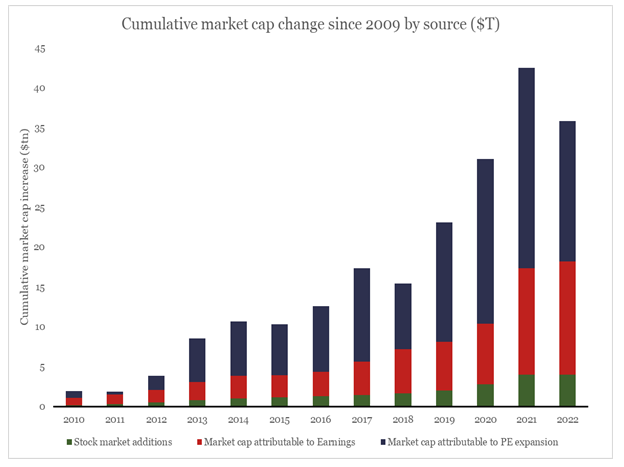
 In summary, of the $42 trillion increase in US (publicly listed) equity market capitalisation since 2009 (to end-2021), $13 trillion can be attributed to earnings growth, $4 trillion can be attributed to new company creation, resulting in the remaining $25 trillion attributed to PE expansion (Fig 2).
Fig 2: Change in broad-US market cap, split by source (EPS vs. PE, $tn)
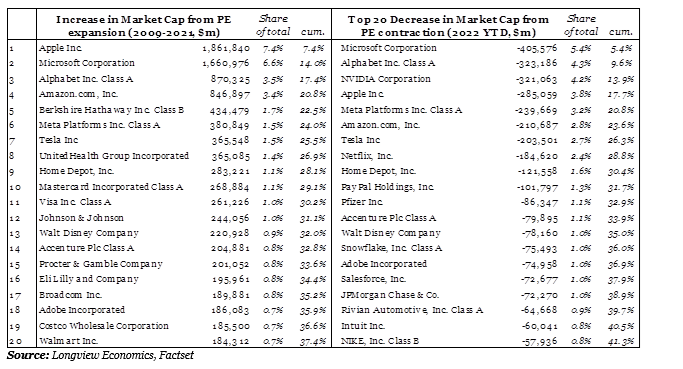
 As table 1 shows, the FAANMGS (along with Berkshire Hathaway), have added the most market cap from PE expansion. Indeed, between 2010-2021, the top 7 companies added $6.4 trillion of market cap over and above earnings growth (i.e. over a quarter of all the valuation re-rating added by the 4,300 companies).
Table 1: Top 20 contributors to US equity market re-rating
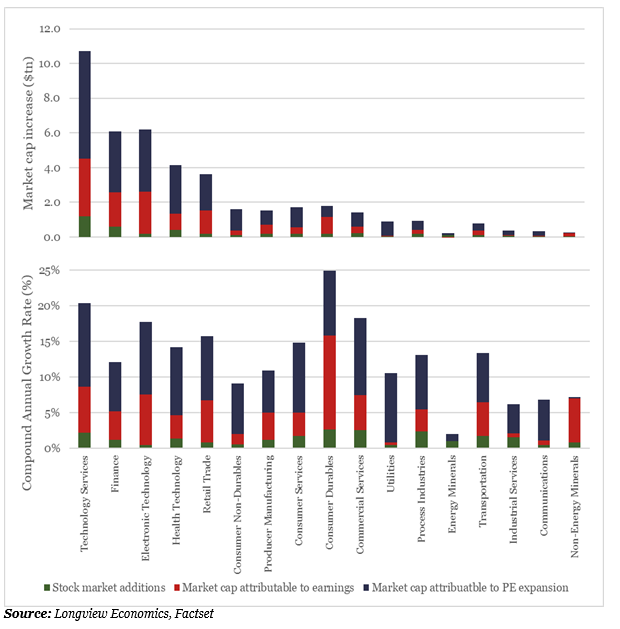
If we look at a sector-lever breakdown, Tech Services, Electronic Technology and Retail Trade have all grown by more than 15% annually (Fig 3). In each of these sectors the majority of the change in the market cap can be attributed to PE expansion.
Fig 3: US sector market cap increase ($tn and CAGR, %) – by source
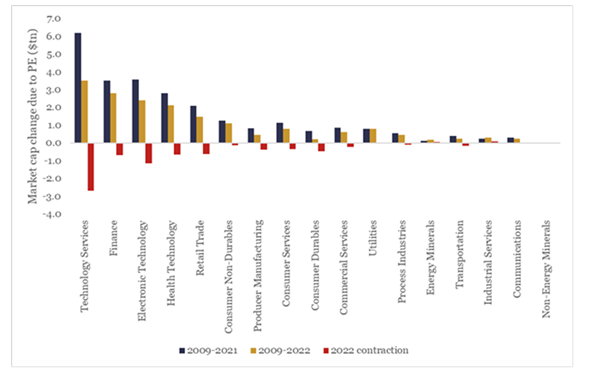
But with central banks starting to tighten/raise interest rates, there’s evidence of that PE expansion starting to unwind. Naturally, it’s the sectors highlighted above that have seen the biggest derating/unwinding. The chart below extracts the market cap change solely attributable to PE expansion through to end-2021, and the equivalent contraction in 2022 so far. As the chart shows, the sectors with the largest PE rerating driven increase in market cap, are the ones with the largest $bn contraction this year. In particular, around half of the market cap due to PE expansion in the ‘tech services’ sector has already unwound (i.e. from $6tn to $3tn, Fig 4). Of note, the behaviour across other sectors is diverse.
Fig 4: Change market cap due to PE expansion, ’09-’21, ’09-’22 and ’22 ($tn)
We further explore derating, marked sector divergence, relative sector observations in our Quant Monthly pieces this month.
If you would like a copy of either publication, please email info@longvieweconomics.com.