Please find below a summary of February's Quant Monthly. Quant Monthly is our new publication which aims to dig deeper into key market and macro questions and focus on marrying up the message of the corporate (and banking) sector with the message of the macro. We typically aggregate income and balance sheet statements across many countries and sectors to provide data and insight not available elsewhere. If you have any questions, or would like to learn more about Longview's services, please contact info@longvieweconomics.com.
Introduction
Ever since the GFC, unprecedented fiscal and monetary support for private and public firms, both in the US and around the world, has saved many companies from failing. With that, a bank of zombie firms has built up. These are firms which are barely surviving, living effectively on ‘monetary life support’, i.e. cheap money.
Indeed, over that time, markets have had bouts of concern about the ‘zombie’ part of the corporate base. Zombie companies are essentially companies which are unable to generate enough profit to cover debt-servicing costs and, therefore, need to borrow to stay alive (see section 1). Those concerns have come back to the fore since the Covid-19 pandemic and its associated economic damage and extreme levels of monetary support (i.e., cheap/plentiful liquidity). As central banks now enter a period of tightening monetary policy and liquidity, there’s concern that the inevitably higher rates that firms will have to pay to service their debt will be the tipping point that pushes many companies over the edge and into bankruptcy (and, with that, increase the risk of recession).
Fig 1: S&P 1500 zombies1 – split by parent index
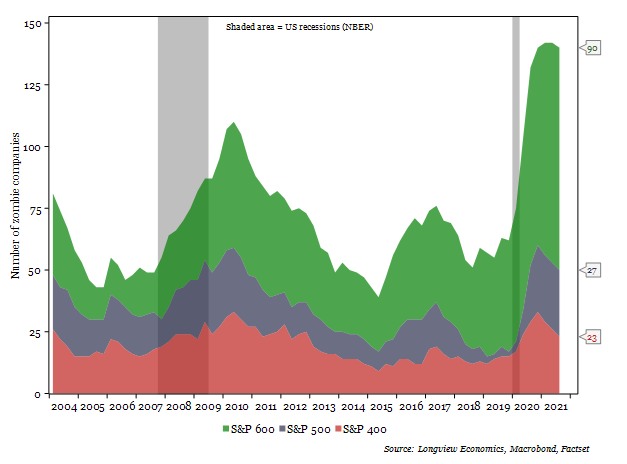
1This chart uses the ‘Zombie 1’ definition – see table 1 for detail and definitions.
Those concerns are well grounded. Analysing the S&P 1500, we show that 10.5% of companies (with available data) have been unable to cover interest payments with EBIT over the past two years. That’s higher than at any point since 2004 (i.e. higher than the peak following the GFC). To assess the potential systemic impact, we have analysed the breakdown of these zombies by size, sector and type.
Digging into the detail shows that a large proportion of those companies, that meet the zombie definition, are part of the S&P 600 small-cap index (i.e. they are at the smaller end of the spectrum). Equally, as our estimates of private sector SME indebtedness show, the debt build-up has also been significant for the small ‘private company’ segment of the corporate base.
From a sector perspective, we also show that the current breakdown of companies classified as zombies are, not surprisingly, many of those most affected by the pandemic. Broadly speaking, these companies are more affected by the declining EBIT than increasing interest payments. Airlines, cruise ships, energy companies and car manufacturers, for example, are some of the worst affected sectors. As the pandemic becomes endemic, and much of the global economy reopens and returns to normality, the sales of those sectors should recover. With debt increasing in those sectors though, and inevitably higher rates over the coming quarters, it will be critical to watch if those most-affected areas of the economy can return to long-term profitability (and cover their interest payments). We analyse some key sectors in Section 2.
Fig 2: EBIT and Interest Expense of 6 selected REITs2 ($m, quarterly)
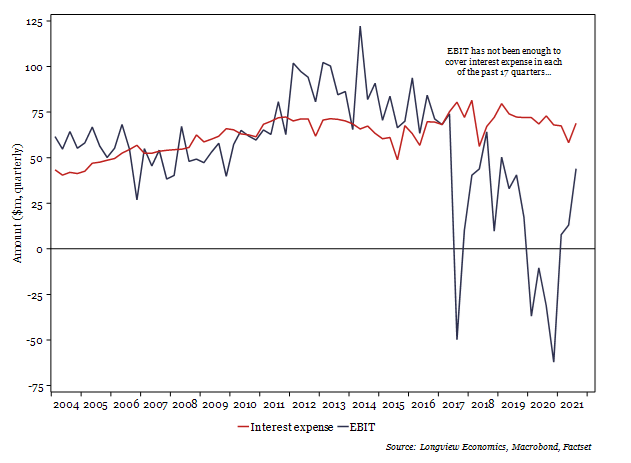
2These are the six REITs falling in the ‘Zombie 4’ classification, namely: American Assets, NexPoint, Acadia, Veris, Centerspace & JBG Smith
One key sector of note, though, is the ‘Real Estate’ sector. We calculate that 23% of the companies in the sector are zombies, on our loosest ‘Zombie 1’ definition, and 6.5% using the strongest ‘Zombie 4’ definition (indeed, those companies make up almost a quarter of all the companies classified as a zombie in that strict definition). Indeed, aggregating the income statements of those zombie REITs, we show that these firms have not made enough earnings to cover interest payments in any of the past 17 quarters (i.e. since Q2 ’17, fig 2).
Section 1: Tightening Liquidity: A Zombie Apocalypse?
The Analysis: For this publication, we have analysed the earnings filings of the S&P 1500 (which is made up of the large-cap S&P 500, the mid-cap S&P 400 and small-cap S&P 600 indices), through to the end of Q3 2021. As there is no official definition of a zombie company, we have used four definitions based on varying timeframes and tightness of rules in this analysis. Those are detailed in Table 1. The principles behind the definitions are consistent, though. We are looking to find companies that have paid more interest than received in pre-tax earnings over the past 2 or 5 years. Two of the measures look at that metric in aggregate (i.e. over the whole time period), while the other two also require that interest payments aren’t covered by EBIT in at least 75% of the reporting quarters. We exclude new companies or those without sufficient data, and exclude those growing (in revenue terms) at a rapid rate.
Table 1: Zombie company definitions used in this publication
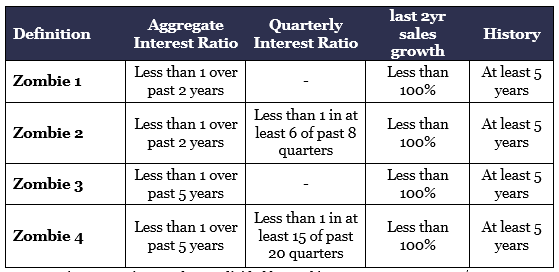 Aggregate interest ratio = total EBIT divided by total interest payments over 2/5 years. Quarterly interest ratio = each quarter’s EBIT divided by interest payments. Last 2 years sales growth = trailing 8 quarters sales growth (relative to prior 8 quarters).
As highlighted above, zombie companies are those most exposed and sensitive to tightening liquidity and rising rates. Tracking the health and behaviour of these companies is important, as these are likely to be the ‘canary in the coal mine’, i.e. the companies most likely to tip into failure/bankruptcy first.
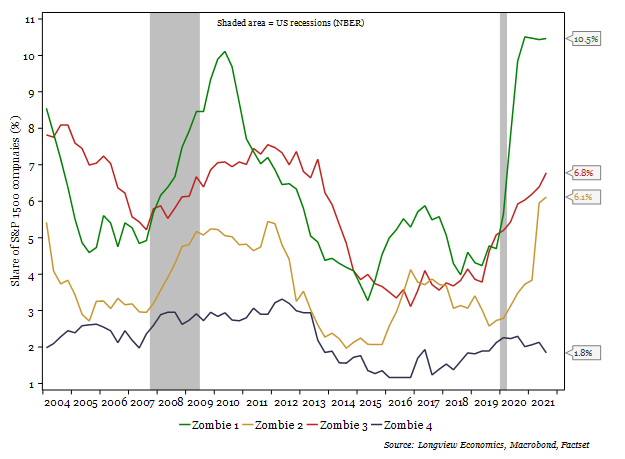
In fig 3, we show the number of companies that classify as zombies by the four definitions listed above in table 1. By the loosest ‘zombie 1’ and ‘zombie 2’ definitions, 10.5% and 6.1% of companies are currently classified as zombies (i.e. over the past eight quarters, interest payments have been higher than pre-tax earnings). That’s at all-time highs (at least since 2004). With the pandemic raging over the past two years, though, that is not particularly surprising, as many companies took large hits to sales and bottom-line incomes as the economy remained closed.
Using the 5-year ‘zombie 3’ definition, though, (i.e. looking at the past five years), the number of zombie companies has been rising since 2017 (although has risen much more significantly since the start of the pandemic).
It’s only when looking at the strictest ‘zombie 4’ measure (i.e. identifying companies with an interest ratio less than 1 in at least 15 of the past 20 quarters), that the proportion of zombie companies is not making new highs. It’s worth noting, though, that the number of companies classified as zombies by this definition has been trending higher since 2016. (NB 25 of the S&P 1500 are currently classified as zombies on this strict definition).
Fig 3: S&P 1500 zombies – the four definitions (% of total companies analysed)
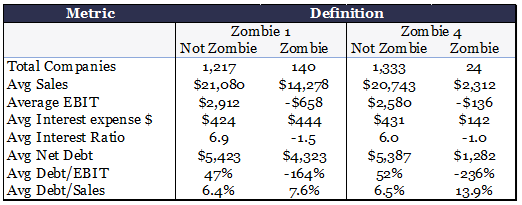
Typically the companies, that have been categorised as zombies, are smaller. Of the 140 S&P 1500 ‘zombie 1’ companies, 90 of those (64%) belong to the S&P 600 small-cap index. That difference becomes more apparent with the tighter definitions. Indeed, of the 25 ‘zombie 4’ companies, 18 (75%) are from the small-caps, while the remaining 25% are from the mid-caps (i.e. none of the S&P 500 companies meet the definition). In table 2 below, we can see that stark difference in company size. The average turnover for a ‘zombie 4’ company is $2.3bn/quarter, while non-zombies are ~9 times larger, averaging $20.7bn/quarter in revenue. Despite being nine times larger, the average net debt is just 4.5 times larger and, reflecting the higher rates the smaller companies are likely having to pay, average interest payments are just three times larger.
Table 2: Average metrics for zombies and non-zombies (zombie 1 & zombie 4)
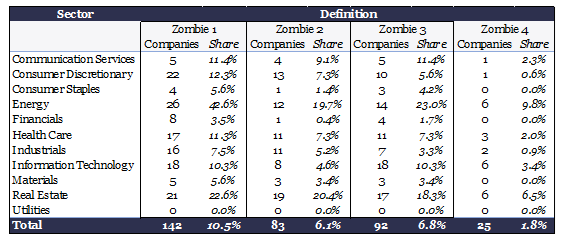
The sector breakdown of the zombies is not particularly surprising. Using the ‘zombie 1’ definition (which focusses on the past two years), the sectors most affected by the pandemic have the highest share of zombies. For much of the past 8 quarters, oil/energy prices have been low and, as such, 43% of the energy sector companies have taken a significant hit to their EBIT and have been unable to cover interest payments. Other key sectors include Real Estate, the Airline industry (within Industrials), and the Hotel & Leisure industry (within Consumer Discretionary). See section 2 for detail.
Table 3: Sector breakdown of zombie companies by definition
It’s also important to note, though, that being classified as a zombie is not a necessary and sufficient condition to suggest the fate of the company is sealed. AMD, the chip manufacturer, for example has been classified as a zombie for 55 quarters since 2004. In recent years, though, the company has significantly increased sales, returned to profitability, and paid off much of its debt (such that net debt is now negative, fig 15).
In conclusion: While the build-up of ‘zombie 1’ companies is significant, the main cause is pandemic related. As the global economy continues to reopen, many of these companies should therefore return to profitability. There remains a number of, particularly smaller, companies that are in an extremely unhealthy position (i.e. the ‘zombie 4’ companies) that are highly exposed to the rising rate environment. Watching these closely over coming quarters will be critical for gauging the risk to the wider economy.