Many market watchers/traders have been confounded/whipsawed by this latest SELL-off, especially in the past two weeks. In particular: i) several key technical support levels have failed to hold; ii) rallies in key indices have lacked follow-though (and turned out to be ‘dead cat bounces’); & iii) a number of stocks have sold off dramatically on poor earnings outlooks, or indeed narrow misses.
Several market commentators attribute each equity move with a recent piece of news flow (e.g. tariffs, Middle East tensions, bond yield movements etc) and try to decipher a market reaction from that. A more effective trading strategy, though, is to look at which of our market timing models are currently correlating the best with the market. Of note in that respect, RAG1 (our key, US centric, risk appetite indicator) has displayed a marked correlation with US equities in recent months (FIG 1).
FIG 1: Longview key ‘risk appetite’ model (RAG1) vs. S&P500
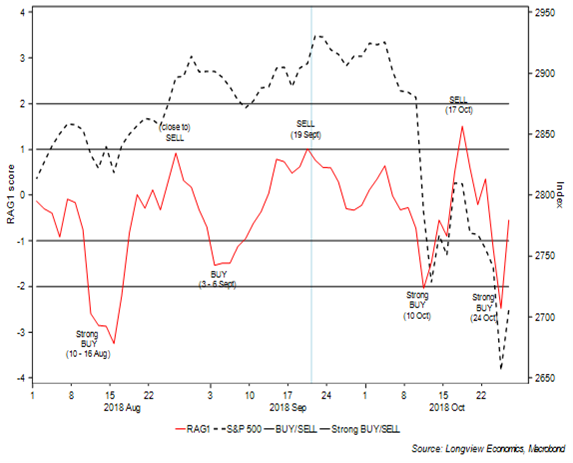
During SELL-offs (i.e. at times of stress in financial markets), risk appetite models should, and generally do, correlate well with the equity market/other risk assets. That happens because correlations across risk assets move towards one. With RAG1 (& the combined RAG1 + RAG2) having generated a strong BUY signal on 24th October (i.e. using closing data), and with RAG1 still at low levels, we would expect some strength in the near term.
Other market signals that support that expectation. Included amongst those:
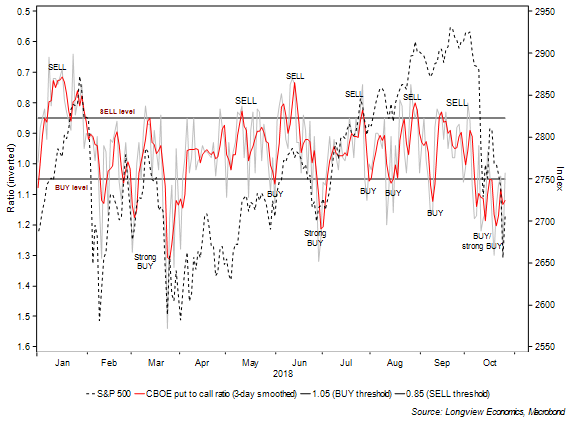
The CBOE short term (smoothed) put to call ratio has now gone for 15 trading sessions with a ratio above one (FIG 2). That is the longest stretch since the period surrounding the BREXIT vote (i.e. mid 2016), when it reached 18 trading sessions.
FIG 2: Short term CBOE put to call ratio (1 & 3 day smoothed) vs. S&P500
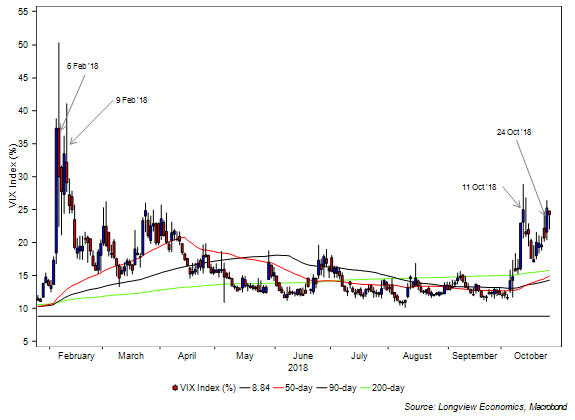
The fact that the VIX failed to make a new intraday high on 24th October (i.e. relative to its 11th October intraday high – FIG 3), despite a new intraday low in the S&P500. That combination often signals a near term low – and last occurred on February 6th & 9th earlier this year.
FIG 3: VIX candlestick chart shown with key moving averages