Recommendation (1 – 2 week Equity Index Trading Recommendation):
- Move ¼ SHORT December S&P500 futures on strength (if forthcoming) at 3,535.0;
- Implement a 2% stop loss on that position.
Rationale
Strength in markets stalled yesterday despite better than expected newsflow during the course of the trading session. That newsflow included good earnings growth from key S&P500 stocks*, and better than expected macro data (notably the strong NFIB data). Financials were the worst performing major sector (despite those good earnings) as US bond yields moved lower (by 5bps). With that, volatility picked up and remains elevated with the VIX still above 20 (as it has been since the Pandemic started to impact the west earlier this year in late February). European equities softened yesterday and remain rangebound (as they have been since June – FIG 1). Global equities, having reached their early September highs, also stalled.
As highlighted yesterday, models are now generating a collective, largely across the board SELL signal (see below), indicating that this recent rally from late September lows is due a pause (or more likely some giveback). The 50 day moving average is a likely target level (i.e. at 3,388), approximately 3.5% below current prices. Encouragingly for the shorts, the price action yesterday was poor despite good earnings results. That supports the view that this rally is overextended, and the near term upside trend is tired. Added to which, the US election is now just under three weeks away while the data shows that current levels of portfolio hedging are low (i.e. see SKEW and put to call readings – FIGs 1, 2b & 2c). Certain outcomes in the election (e.g. a contested result) have the potential to add to market volatility/uncertainty. With those risks now in sight, it seems likely that money managers will start implementing hedges against those eventualities (i.e. effectively selling the market through options strategies, which is typically consistent with near term weakness).
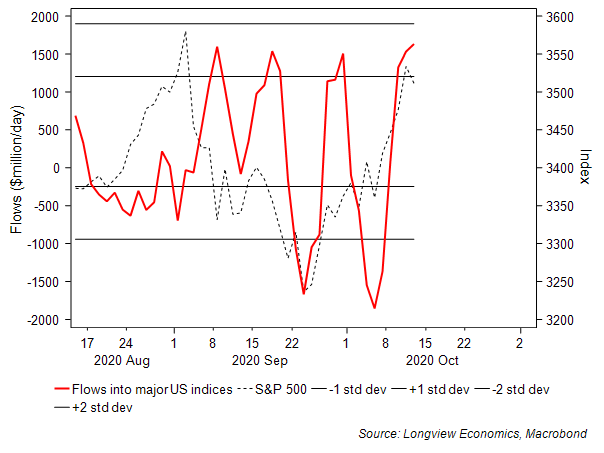
Message of the models: Markets are overbought at an index, sector and single stock level (FIGs 2, 2d & 2e); risk appetite is high – that is market participants, following on from the ~8% rally from 24th September lows, have become greedy (FIG 2a); while downside put protection is low (FIGs 2b & 2c) and ‘hot’ short term money flows into equity index LONG positions have been high (i.e. with this model now back on SELL – FIG 2f). As such, all the key short term models are now on/close to SELL and collectively generating a ‘clear and across the board’ 1 – 2 week SELL message.
As such, we recommend starting to BUILD SHORT positions. In particular we recommend moving ¼ SHORT S&P futures on strength, if the index moves back towards its highs of the past 2 trading sessions (i.e. those highs are at 3,541 approx. 1% above current levels). We also recommend a 2% stop loss, which places the stop above the 2nd September intraday record highs of 3,587 (a key resistance level).
Kind regards,
Longview Economics/Shortview Trading
*including JP Morgan amongst others.
FIG 1: EuroSTOXX candlestick shown with its 50 & 200 day moving average
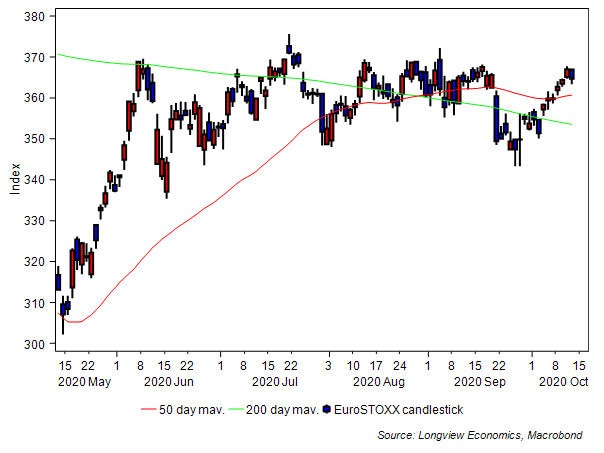
FIG 1a: US CBOE SKEW index vs. S&P500
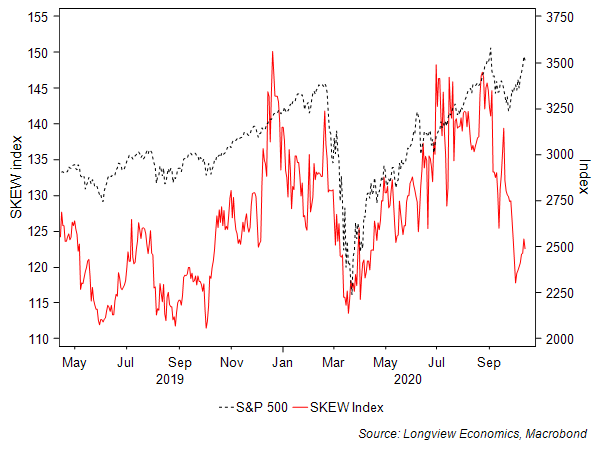
FIG 2: Longview S&P500 short term ‘technical’ scoring system vs. S&P500 futures
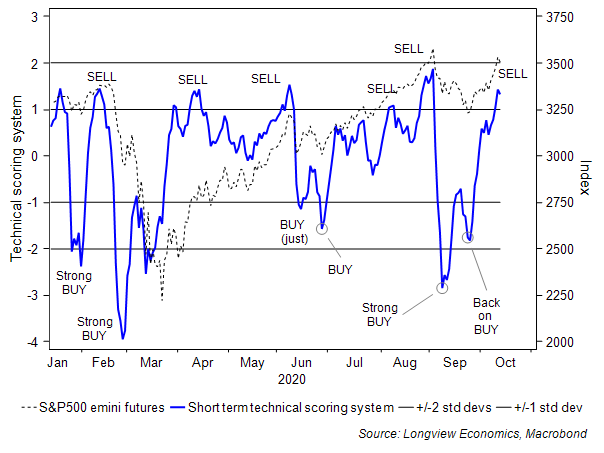
FIG 2a: Longview short term ‘risk appetite’ scoring system vs. S&P500
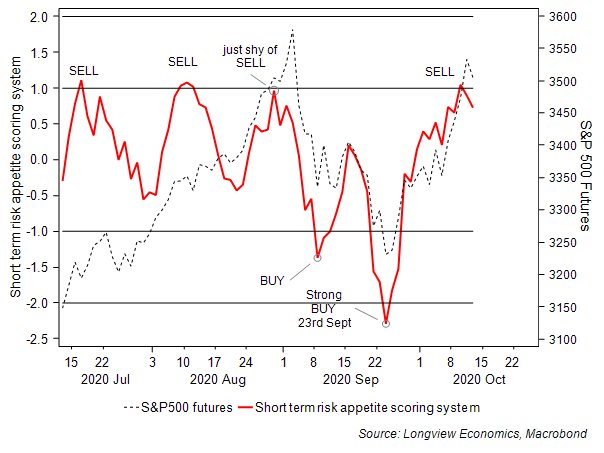
FIG 2b: CBOE put to call ratio (1 & 3 day smoothed) vs. S&P500
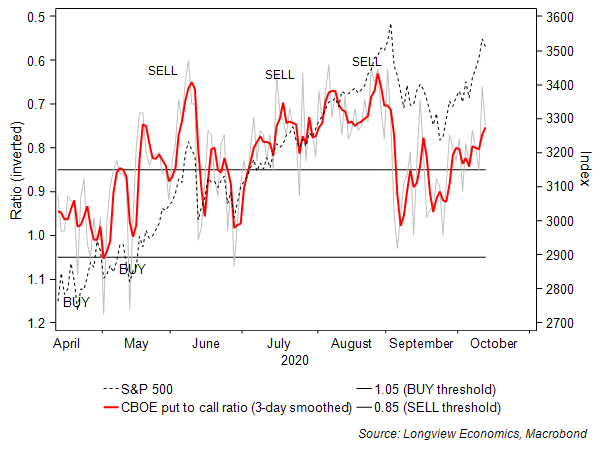
FIG 2c: NDX100 put to call indicator (1 & 3 day smoothed) vs. NDX100
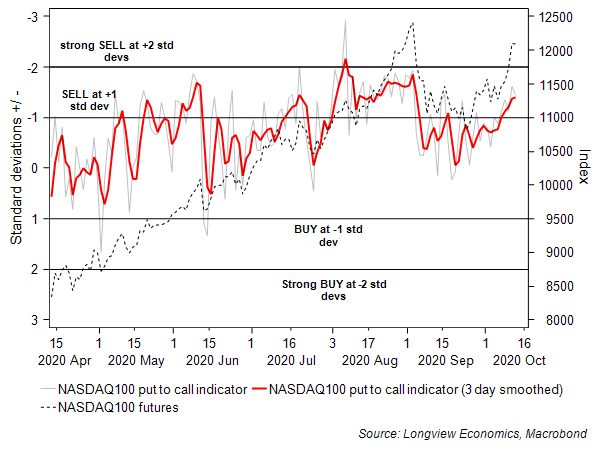
FIG 2d: Percentage of US stocks above their 10 day moving averages vs. S&P500
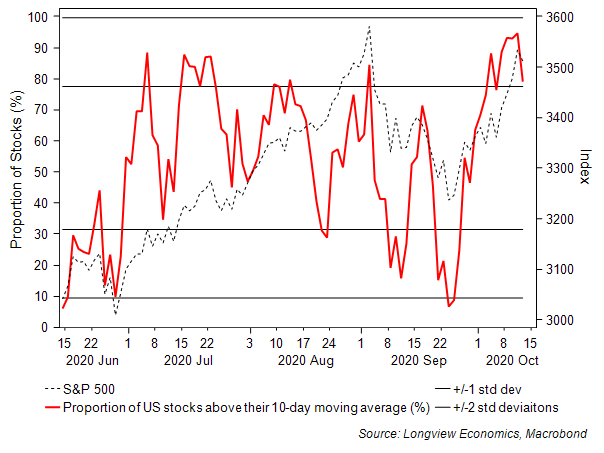
FIG 2e: Average short term 14d RSIs of US industry groups (i.e. all 24) vs S&P500
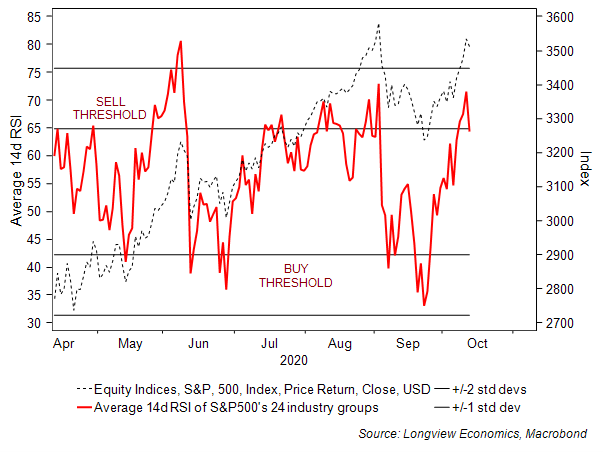
FIG 2f: Major US index ETF flows (10 day smoothed) vs. S&P500
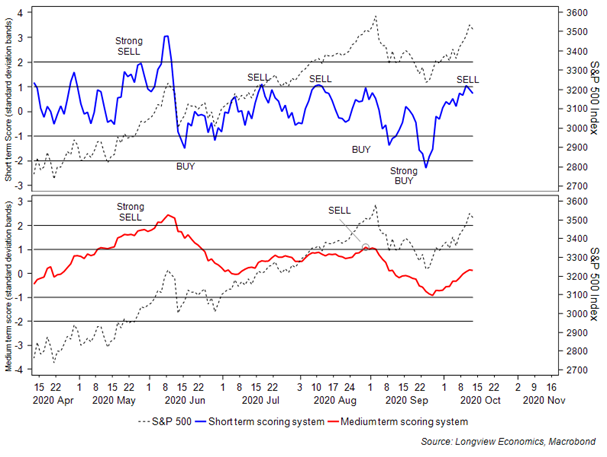
Key Longview Scoring Systems (chart below):
Short term (1 – 2 week) scoring system (fig 1b): NEUTRAL (from SELL earlier in the week)
Medium term (1 – 3 month) scoring system (fig 1c): NEUTRAL
FIG A: Longview short and medium term scoring systems vs. S&P500
Key macro data/events
Key macro data today includes: EZ industrial production (Aug, 10am); US weekly MBA mortgage applications (12pm); US PPI (Sept, 1:30pm).
Key events include: Speeches from the Fed’s Barkin (1:30pm), Clarida (2pm), Quarles (3:30pm) and Barkin (7pm); the ECB’s Lagarde (9am) and Lane (1pm); and the BoE’s Haldane (5pm).
Definitions & other matters:
RAG = Risk Appetite Gauge
The ‘Daily RAG’ publication is designed to generate 1 to 2 week trading recommendations on equity indices. For trading recommendations on currencies, rates, bonds and other assets, pls see Macro-TAA trade publications.
For a Medium term recommendation please see our 1 – 4 month tactical market views which are updated at the start of each month in our Tactical Equity Asset Allocation publication (as well as occasional ad-hoc intra month Alerts). The latest update was published 6th October. If you are not on the distribution list and would like to receive these reports pls email info@longvieweconomics.com