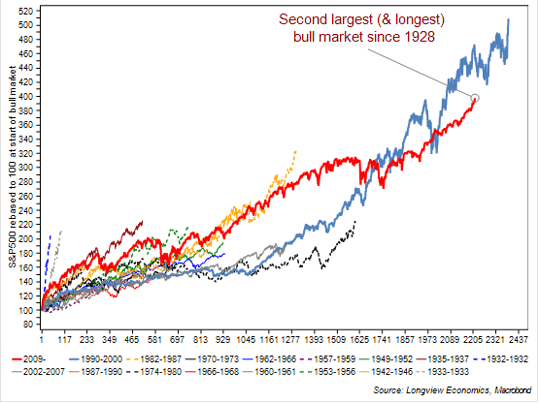
There seems to be a growing list of reasons to worry about the outlook for equities. In particular, on many metrics, this bull market appears increasingly tired (e.g. see FIG 2) whilst the economic expansion, on some measures, looks increasingly mature and vulnerable.
In particular, from an equity market perspective, the US Shiller PER is now back at its highest level since 1929 (with equities only more expensive in the 1990s tech bubble). With that, cash levels in portfolios are already back at tech bubble levels (i.e. their lowest since December 1999, FIG 1). In that respect, market participants appear to be fully (if not overly) committed to equities*. Illustrating that, it’s now been 384 trading days since the S&P500 had a 5% (or greater) pullback. That’s the (joint) 3rd longest winning stretch since 1928.
FIG 1: Portfolio cash levels (%, individual investors, AAII survey)
FIG 1a: WTI candlestick chart – shown with key moving averages and resistance levels
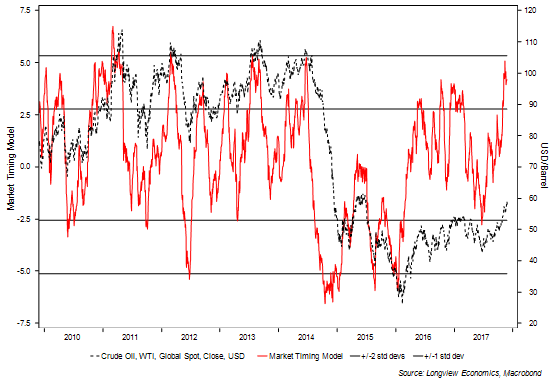
Added to that, a bounce to around that level would likely generate a full set of SELL signals on our medium term models. Already our market timing model for oil (which aggregates a variety of factors) is on SELL (and close to strong SELL – FIG 2). Looking back over time, a significant majority of those SELL signals have been effective on a multi month time frame. Other medium term models (e.g. Consensus sentiment, medium term technical model for BRENT), whilst close to SELL are not yet at those levels. Net speculative positioning is also high. As laid out HERE, we recommend starting to move SHORT OIL futures (on a multi month timeframe) if that rally up towards key resistance levels is forthcoming.
FIG 2: Longview OIL Market Timing Model vs OIL price (WTI)
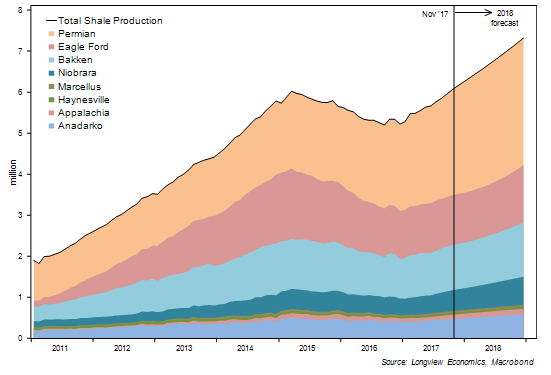
That view is consistent with the fundamentals in the oil market. In particular, we expect shale producers to increase production in 2018 by approximately 1mbpd – FIG 3……
FIG 3: US shale production (actual & forecast), mbpd
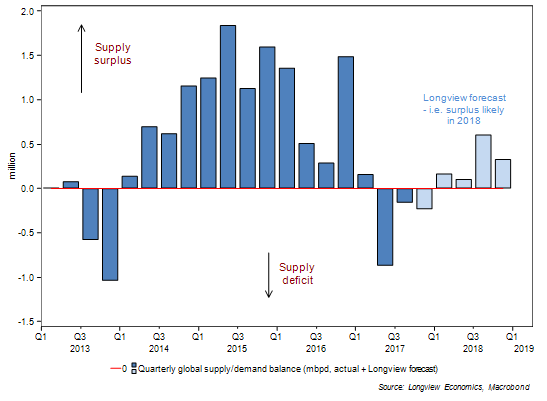
…which is one of the key reasons why we are forecasting a global supply surplus that year (FIG 4).
FIG 4: Longview oil supply & demand balance (mbpd, actual vs. forecast)
For full analysis of the fundamentals please see HERE.
The electric car revolution has been quickly forgotten as the oil price has rallied. Beyond the next few months, and indeed years, though, it remains key. In that respect the IMF’s recent analysis (from May this year – see HERE) is a good reminder of the potential speed of take-up of certain technologies. Key findings are summarised below:
An Electric Vehicle Revolution – How credible is it?
“The stone age came to an end not for a lack of stones, and the oil age will end, but not for a lack of oil.”
Sheikh Zaki Yamani, (former Saudi Arabian oil minister, 1962 – 1986)
It’s readily and widely accepted that, at some stage, oil will no longer be the world’s primary energy source. A decade ago, ‘peak oil supply’ was expected to deliver that change. Now, with the take up of electric vehicles (EVs), ‘peak oil demand’ is the key long term threat to the world’s oil market. That ‘peak demand’ expectation fits the pattern of history. Indeed, as the quote above alludes to, changes in the main energy source are usually demand driven.
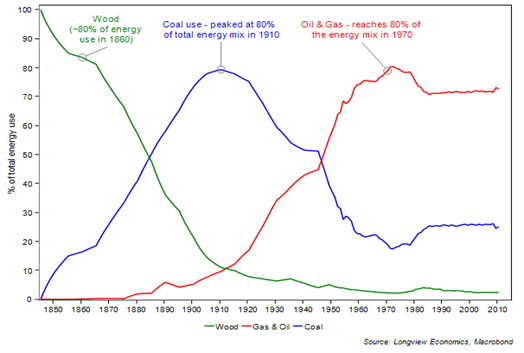
In recent centuries, such changes have been both fast and frequent. Between 1860 and 1910, for example, the primary source of US energy switched from wood to coal
(i.e. over the course of just 50 years). By 1970 (i.e. 60 years later), it had changed again (from coal to oil & gas), see FIG 5.
FIG 5: Sources of US energy (% of total), 1845 – present
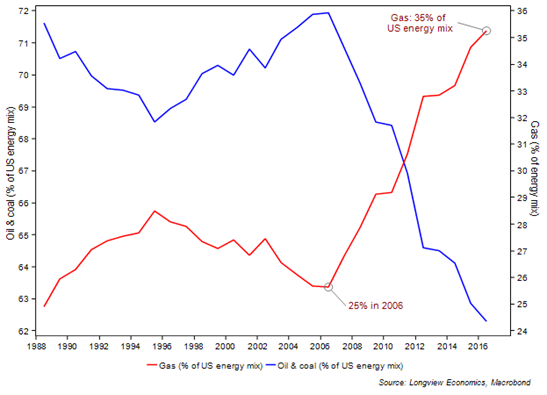
Fast forward another 50 years, and another structural shift in the energy mix is underway – i.e. away from oil and coal and towards gas. Natural gas now accounts for 35% of US energy (up from 25% a decade ago). The combined share of coal and oil has fallen by a similar magnitude (mostly reflecting a move away from coal).
FIG 5a: Sources of US energy (% of total), 1988 – present
The nub of the (long term) oil market debate, though, as always in markets, is timing. In particular, over what time frame can we expect a significant and rapid take up of electric vehicles (which would accelerate the recent shift away from oil – see chart above) and towards renewables (and probably towards more gas)?
Our analysis suggests that, if auto maker targets are reached, then the penetration of EVs into the global passenger car fleet will be ~50% by 2040. In other words, half of the 2 billion passenger cars on the roads by 2040 will be electric.
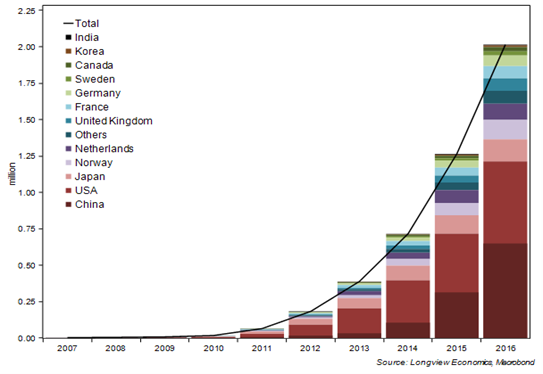
Instinctively, that seems unrealistic – perhaps because it’s a significant, rapid, non-linear step change (i.e. the type of significant change which is usually outside of consensus thinking). Indeed, for that forecast to be correct, the world’s current vehicle fleet of EV cars (currently only 2 million) would need to grow by 30% p.a. (on average) to reach 1 billion by 2040.
The context of rapid changes in the energy mix (as noted above) is therefore instructive. It’s also worth noting, as we highlighted in early November (see HERE), that the sales trajectory of EV cars is already rapid (and currently growing at around 70% p.a.). With that, auto makers are channelling their R&D/capex budgets into developing a comprehensive EV offering (and maintain relatively high growth rates). By 2019, for example, all new Volvo cars will be electric. By 2020, all new Jaguar-Land Rover models will be electric. By 2020, 40% of Ford’s models will be electric.
Rapid growth in the world’s EV fleet (FIG 5c) is therefore likely to continue and, with that, if auto makers deliver on their promises, consumer choice will become increasingly restricted/re-orientated towards the EV product range.
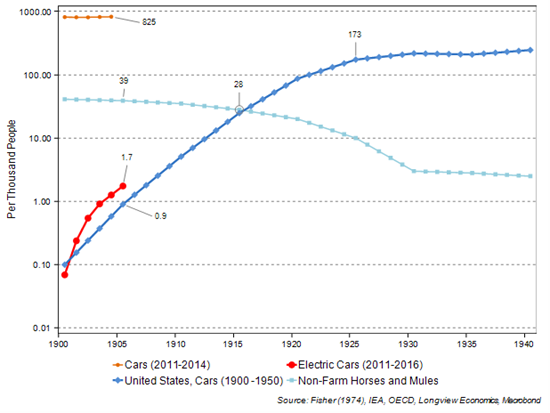
A recent study by the IMF is interesting in that respect – showing that the take up of EVs in the past 5 years is not dissimilar to the take up of motor vehicles in the early 1900s. In fact, take up of EVs (per person) is happening more quickly (see FIG 5b below – NB log scale). On the current trajectory, therefore, traditional combustion engine motor vehicles, like horses & mules in the early 20th century, are poised to become a footnote in the history of mass transportation.
FIG 5b: Cars & horses per thousand people (US, various time frames), log scale
Long term global oil demand growth is likely, therefore, to be significantly impacted by these changes (i.e. over the course of the next several decades). Historically, global demand has grown at around 1.5%. Under our scenarios, that growth rate is likely to slow (to probably sub 1% by the middle of the next decade – see HERE for detail).
FIG 5c: Global fleet of electric cars (battery & plug-in hybrid combined), million
For a full list of Longview publications over the past fortnight, please see below (NB excluding the Daily RAG).
Have a great weekend
Kind regards,
Longview
Longview Research recently published:
This week:
Macro Trade Recommendation No. 84, 30th November 2017
“Move SHORT WTI” –
Commodity Fundamentals Report No. 80, 30th November 2017:
“OIL: Turning on The Shale Taps (…again)” –
Weekly Market Positioning Update, 28th November 2017:
"Cyclical Positioning Tilt Continues"
The prior week:
Commodity Fundamentals, Report No. 79, 16th November 2017:
"Gold - Disaggregating the Drivers a.k.a. Why it's going down"
Macro Trade Recommendation No. 83, 16th November 2017:
"Further on the Flattener"
Weekly Market Positioning Update, 14th November 2017:
"Oil Positioning - Close to Multi-Year Highs"

Chris Watling
CEO & Chief Market Strategist,
Longview Economics
switchboard: +44 (0) 870 225 1388
direct line: +44 (0) 20 7062 8804
mobile: +44 (0) 7796 017032
email: chriswatling@longvieweconomics.com
website: www.longvieweconomics.com
twitter: @LongviewEcon
Market Timing, Macroeconomic, Thematic & Commodity Research
Notice: This email is intended for the named recipient only. It may contain privileged and confidential information. If you are not the intended recipient, notify the sender and destroy this email. You must not copy, distribute or take action in reliance upon it.
Whilst all efforts have been made to safeguard emails, Longview Economics cannot guarantee that attachments are virus free or compatible with your systems and does not accept liability in respect of viruses or computer problems experienced.
Longview Economics reserves the right to monitor all emails.
No legally binding commitments will be created by this e-mail message. Where we intend to create legally binding commitments these will be made through hard copy correspondence or documents.
Longview Economics Ltd. is an appointed representative of Messels Limited. Messels Limited is authorised and regulated by the Financial Conduct Authority.