Summary of markets last week:
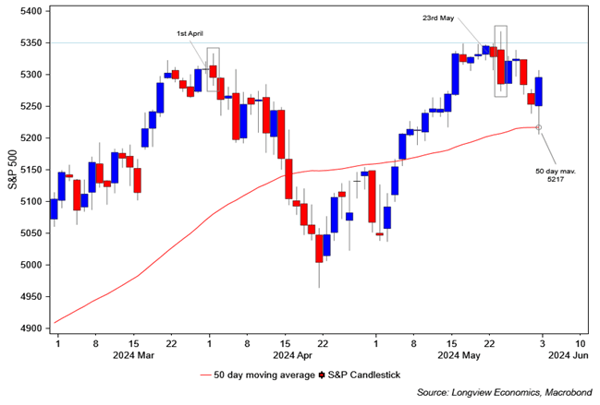
Momentum in US equity markets rolled over to the downside last week. That breakdown began tentatively the week before on 23rd May, when the S&P futures broke below their tight trending range of the prior five trading sessions (see chart). It was then confirmed by equity market weakness on Wednesday and Thursday last week, as the index went below its next key support level, i.e. 5,266/73 on futures (before a sharp, final hour, short covering rally into the close on Friday).
Equities (& bonds) were whipsawed by the US macro data released during the week. Earlier on in the week, consumer confidence and the Richmond Fed survey were both much stronger than expected, triggering a back-up in US 10-year bond yields (and pressure on US equities). Later in the week, Q1 GDP was revised lower, pending new homes sales disappointed while the Chicago Fed PMI fell sharply (to a level consistent with recession). In response bond yields fell, largely round tripping over the course of the week (& ending the week at 4.51%, 5bps above where they started).
Given that mixed macro message, this coming week will be critical. In particular, it’s the main US macro data week of the month. ISM manufacturing is published on Monday, ISM services is out on Wednesday (along with ADP payrolls data), while the week concludes with the closely watched non-farm payrolls, unemployment and related labour market data on Friday. All of which will be closely watched, along with the 5,217 level on S&P500 futures - a key support level (the 50-day moving average). For full details of next week’s key events, see below.
Elsewhere, over the weekend, “India’s Modi looks set to have won a decisive majority in the Indian election” (source: CNBC), “China has landed a spacecraft on the far side of the moon” (source: Bloomberg) , while “China’s defense minister, Adm. Dong Jun, vowed that anyone who aims to separate Taiwan from China will face “self-destruction.”” (source: CNBC).
Longview’s latest views on markets, as always, are laid out in our key publications, including: i) The ‘Daily Risk Appetite Gauge’ (1 – 2 weeks views on S&P500 futures); ii) ‘Tactical Asset Allocation’ (‘1 – 4’ month views on the direction of global equity markets); & iii) our ‘Global Asset Allocation’ publication (with a 6 month to 2 year timeframe across all asset classes).
Key chart: S&P500 futures shown with key moving average
|


