Summary of markets last week:
After posting a bullish key day reversal* pattern on Friday 31st May (10 days ago –> a positive ‘technical’ signal), the S&P500 rallied 1.3% last week and made another new record high. That strength was led by the tech sector and, specifically, the mega cap stocks. Nvidia, for example, was over 10% higher on the week; Amazon was 4.4% higher; while Microsoft was up over 2%. For most of the week, the rally was supported by the fall in bond yields & rate expectations (on weaker than expected ISM
Manufacturing and ADP readings). On Friday, though, that reversed as nonfarm payrolls and wage inflation both surprised to the upside and yields backed up. Equites, though, remained relatively resilient.
The key question, therefore, is whether that resilience will persist in coming weeks? Our short-term view on equity market direction, as always, is laid out in our ‘Daily Risk Appetite Gauge’ publication (with ‘1 – 2’ week recommendations on S&P500 futures). Our medium term (‘1 – 4’ month view) is addressed in our monthly ‘Tactical Asset Allocation’ publication. This was updated last week – see below for detail. Longer term investors should refer to the ‘Strategic Global Asset Allocation’ reports (for our ‘6 months to 2 years’ recommended global asset allocation portfolio).
Next week is another big week for macro data and events, mostly notably with Wednesday’s US inflation report, which is then followed by the Fed’s policy decision, update of its economic projections (including the infamous ‘Dot Plots’) and press conference later that day (7pm & 7:30pm London time). Elsewhere NFIB small business optimism is due on Tuesday, with PPI (Thursday) and Michigan sentiment (Friday) both released later in the week. Outside the US, Chinese CPI is out on Wednesday and the BoJ will announce its policy decision on Friday. See below for a full list of key data/events.
Key chart: S&P500 futures candlestick shown with its 50-day moving average
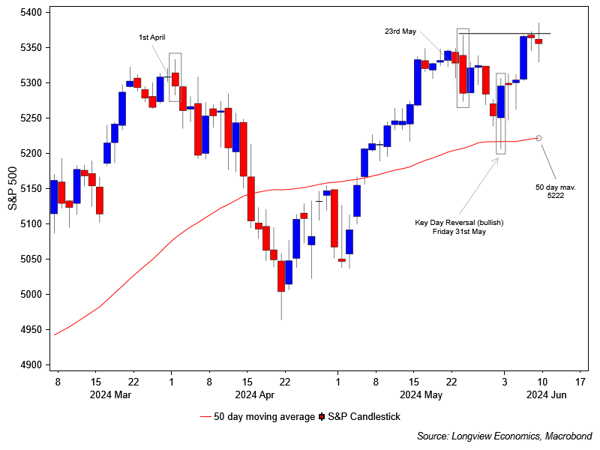
*Key day reversals typically signal a change of near-term trend (in this instance, from bearish to bullish). That happens when the index opens lower, makes an new intra-day low (i.e. below the prior day’s low), and then closes above the prior day’s intraday high.
|


