Parabolic Bond Prices
“It’s the new paradigm – buy equities for yield & bonds for capital gain”
Source: Anonymous
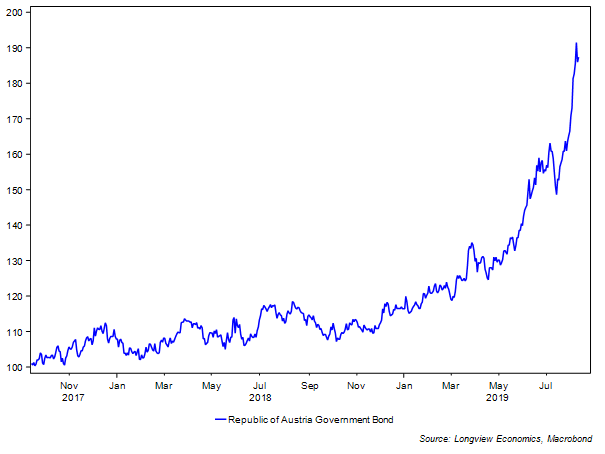
With bond prices going parabolic in the past few weeks (FIG 1), once again market participants are wondering whether the “bond market is in a bubble”. That concern first surfaced, in the mainstream, when yields initially started turning negative during the Eurozone crisis. While negative yields have become more widely accepted in recent years, this latest move has surprised many investors (including us) with respect to its speed and the extent of the move.
Of note, in that respect, the US 30 year bond is up approx. 15% this year, while the Austrian 100 year bond is around 60% higher (FIG 1)…
FIG 1: Austrian 100 year government bond price
… while the yields on various low rated, developing countries’ 10 year government debt is as low as 1.88% in Hungary, 1.36% in Croatia, and 0.82% in Cyprus. In Greece, the 10 year yield has made a new record low last month (of 1.99%, and down from 37.1% in the Eurozone crisis).
Kindleberger’s Framework for Defining Asset Price Bubbles
Charles Kindleberger, a renowned economic historian and author of over 30 books, laid out a detailed framework for defining bubbles in his well-known book ‘Manias, Panics and Crashes’. His four factors can be summarised as follows:
- cheap money underpins and creates the bubble;
- debt is taken on during the bubble build-up, which helps fuel much of the speculative price increases (e.g. buying on margin);
- once a bubble is formed, the asset price has a notably expensive valuation; &
- there’s always a convincing narrative to ‘explain away’ the high price. Reflecting that, there’s a wide acceptance in certain quarters that the price is rational (and that ‘this time it’s different’).
Bubbles are also typically accompanied, towards their final phase, by parabolic price action.
Factor (iii): Valuation
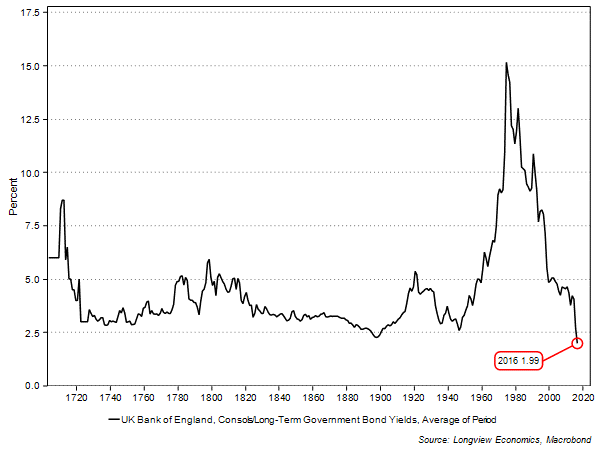
With that framework in mind (& starting with point iii), it’s clear to any rational observer that the valuation of bonds is absurd. Negative yields on government bonds have not been experienced in the past several hundred years (until 2012). FIG 2 illustrates that back to 1870. A cursory glance at the UK’s ‘consols’ yield back to 1700 shows that the prior low on yields was at 2.3% in 1897 (FIG 3). In the remaining 300 years or so, yields have been above that level. Similar charts for other European countries tell the same story.
FIG 2: Hundred & fifty years of government bond yields (Swiss & Swedish government yields, %)
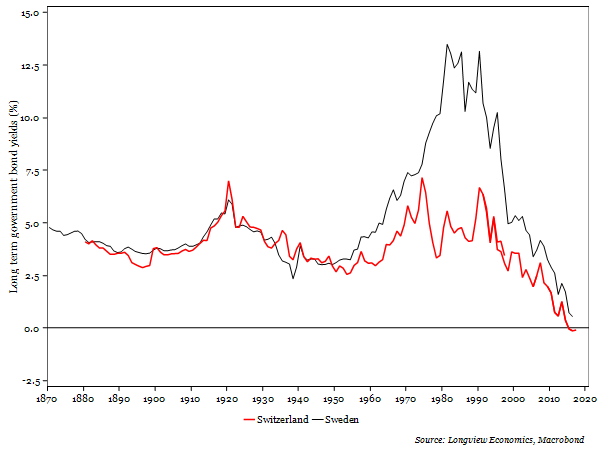
FIG 3: UK ‘consols’/government bond yields (1700 – 2016, %)
Intellectually, in the context of the basic building blocks of an economy, the concept of negative yields is inconsistent with how a financial system should work. That is, in a normal system, savers are compensated for deferring consumption and thereby paid for the time value of their money and borrowers pay for the privilege of borrowing money. In certain parts of the western world, though, some mortgage holders are now being paid to borrow money to buy their house (e.g. see Denmark - HERE). Governments, of course, are also being paid to borrow (and therefore spend). Given the typically notably lower trend productivity growth rates of governments relative to the private sector, this is a recipe for lower trend productivity growth overall and therefore lower trend GDP growth and less wealth accumulation.
Equally if borrowers don’t pay for the privilege of borrowing money, capital allocation discipline should then break down, as the rate of return hurdle for new projects falls (or even potentially turns negative), making more and more projects feasible and overly boosting supply/competitive pressure.
Arguably this is already the case in parts of private equity. As private equity has become a key beneficiary of a lack of yield elsewhere, valuations on new rounds of funding have come at ever richer multiples of sales, while profits have remained elusive for most of the 300+ ‘unicorns’ created in the past decade. Uber’s results yesterday are a case in point, with Uber reporting a greater than expected US$5 billion loss in part reflecting pricing pressure from increased competition (and this is a company which has never made any money).
Added to that, the government’s interest rate is the risk-free rate, against which all other assets are priced (i.e. an asset’s yield = risk free yield PLUS its risk premium). In that context, a negative risk-free rate has, as is well observed, pushed the value of almost all assets to a more expensive level (i.e. the ‘everything bubble’). According to the Federal Reserve’s analysis, for example, all asset classes have risen faster than nominal GDP growth in the past 20 years (see recent Longview on Friday for detail - available HERE).
Overall therefore, a negative risk free rate implies that the owner of the ‘risk free’ asset is paying for the privilege of owning it. Paradoxically, the ‘risk free’ asset is becoming ever riskier because of its rich, and unprecedentedly high, valuation level (clearly an internal inconsistency). Meanwhile, at the same time, the borrower is being paid to borrow, thereby distorting incentives in an economy which in turn leads to misallocation of resources.
Alternatively, this can be considered through the lens of Hyman Minsky’s framework for cycles/speculative build-ups to a ‘Minsky moment’. Minsky highlights three different types of borrowers, who are participants in that build-up. They include the ‘hedge borrower’, the ‘speculative borrower’ and the ‘Ponzi borrower’. Those that buy negative yielding debt are equivalent to the ‘Ponzi borrowers’:
“The "Ponzi borrower" borrows based on the belief that the appreciation of the value of the asset will be sufficient to refinance the debt”
Now, because the position of the borrower and lender is reversed (in the world of negative yields), the analogy slightly falters. What’s clear, though, is that any pension fund, or other investor, that buys negative yielding debt will lose money unless the price of the asset moves higher (i.e. and the yield lower); OR unless there is significant and persistent deflation in prices, such that, in real terms, the return on the asset is positive (albeit in that eventuality cash would yield a higher real return). Buying an asset that it costs money to own, therefore, is equivalent to the approach of the Ponzi borrower, as it necessitates an expectation of further price appreciation (despite the already unprecedented valuation risk). Hence the relevance of the front page quote.
Factor (iv): The ‘Convincing’ Narrative
Furthermore with respect to Kindelberger’s point (iv) above, a ‘reasonable’ explanation as to why this time is different, has been emerging. Pension funds, for example, are forced by the regulatory backdrop to buy these bonds. Or, as argued in an article in Bloomberg yesterday (see “The Non-Weirdness of Negative Interest Rates” – LINK), negative rates simply reflect that “saving is all too plentiful” (and therefore negative rates are a natural extension of that). More accurately, though, saving is not all too plentiful, it’s simply that the pool of investible assets has shrunk considerably as central banks have created new money – hoovering up those investable assets onto their own balance sheets (thereby leaving more money chasing fewer assets). As such it’s not the demand side of the equation that’s distorted prices, it’s the shrinking of available supply.
Factors (i) & (ii): Cheap Money and Debt Accumulation
Finally in relation to the first and second factors (i.e. debt & cheap money), its widely accepted that money has been ‘cheap’ for most, if not all, of the past decade. That’s illustrated by negative, or very low, policy rates (as well as negative real rates).
While, with respect to debt, the analogy is more complicated. Clearly, though, risk parity funds use debt to buy bonds on margin, while CTA momentum investors will also be buying on margin (i.e. with implicit debt). More interestingly, though, the biggest buyers of sovereign debt in the past decade have been the major central banks. Their purchases have been made with newly created money. While hotly contested conceptually (especially by proponents of MMT), ‘bank reserves’ (i.e. newly created money) is a liability, and, in that respect, by extension a form of debt (especially the ‘excess’ reserves component). Over and above that, it’s notable that margin lending in other asset classes has also become extreme, and given those other assets are linked to government bonds through their risk premiums, this is a valid confirmation of factor (ii). That’s evident, for example, from the NYSE net margin debt measure (one piece of evidence demonstrating the extent of buying of US equities on margin). This metric is just shy of record TMT bubble highs (i.e. when measured relative to the stock market capitalisation).
The one factor that bursts bubbles
Kindleberger then goes on to outline that it’s always the removal of cheap money that bursts the bubble. As such and given that almost all central banks are now either easing or holding an easing bias, the cheap money is not being removed (unless one takes the view that 2018 was an overtightening*). The bubble, therefore, has theoretical room to continue inflating.
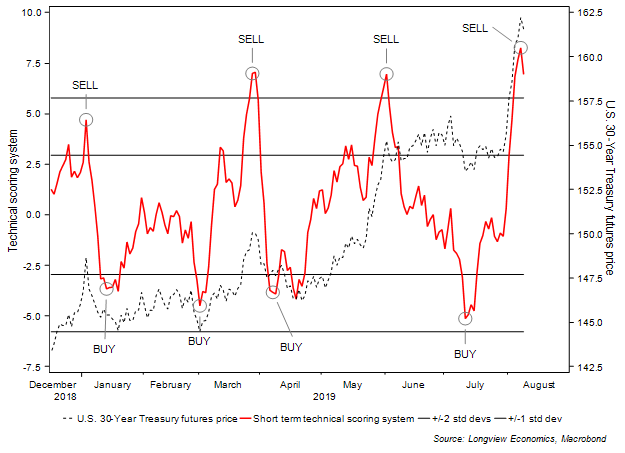
Given the following factors, however, we expect bonds to give back some, if not most, of their recent gains over coming months:
- the crowded, and consensus, nature of overweight bond positions;
- the overbought nature of bonds in the short & medium term (see FIG 4); as well as;
- overly bullish sentiment (e.g. see Consensus Inc bond sentiment indicator).
- growing evidence that a mini re-acceleration in the US & global economy is likely
FIG 4: Longview US 30 year bond futures short term ‘technical’ scoring system vs. US 30 year bond futures
*NB which is NOT confirmed by the majority of monetary indicators that we follow.
Certain Long Term Correlations are Breaking Down
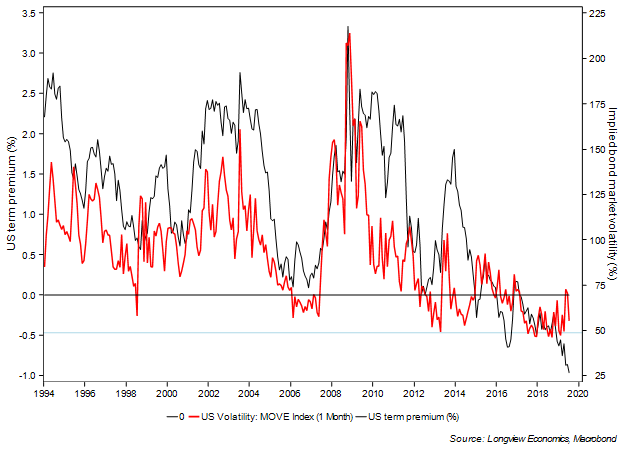
Over and above that framework highlighted above, it’s also interesting to note that certain historical correlations are breaking down. The MOVE (bond volatility) index, for example, has stopped correlating with the US bond’s term premia in recent months. From the mid 1990s (start of data) until the end of last year, those two moved broadly in tandem. In recent months, though, that correlation has broken down. Given that both are measures of bond volatility/bond risk, this correlation should be expected to re-establish itself. Its breakdown, therefore, suggests that the price behaviour of bonds is probably irrational.
FIG 5: US bond volatility (MOVE index) vs. bond term premia (%)
Have a great weekend.
Kind regards,
Longview
Market Timing, Macroeconomic, Thematic & Commodity Research
Notice: This email is intended for the named recipient only. It may contain privileged and confidential information. If you are not the intended recipient, notify the sender and destroy this email. You must not copy, distribute or take action in reliance upon it.
Whilst all efforts have been made to safeguard emails, Longview Economics cannot guarantee that attachments are virus free or compatible with your systems and does not accept liability in respect of viruses or computer problems experienced.
Longview Economics reserves the right to monitor all emails.
No legally binding commitments will be created by this e-mail message. Where we intend to create legally binding commitments these will be made through hard copy correspondence or documents.
Longview Economics Ltd. is an appointed representative of Messels Limited. Messels Limited is authorised and regulated by the Financial Conduct Authority.