“You have got to recognise that we need a national mobilisation. You’ve got to recognise there is a health and care crisis coming over the next three or four months and accept it, acknowledge it and encourage the public to do everything they can to help.”
Source: Matthew Taylor, chief executive of the NHS Confederation, 20th Oct 2021
Despite a strong vaccine rollout, the start of booster jabs, a relatively conservative return to offices and limited use of mass transit, the Covid situation in the UK has deteriorated since mid-summer. Infections have remained between 25k and 50k per day since 6th July and are currently at the top end of that range. Hospital admissions and deaths, while much lower than in previous waves, remain elevated (with between 5k and 10k patients in hospital each day in recent months, and 100-150 daily deaths).
Fig 1a: Percentage of positive tests in England – split by age bracket
.png?width=524&name=fig%201a%20(2).png)
As we approach winter, where flu-like respiratory viruses are more virulent, and where last year there was a large spike in cases, hospitalisations, and deaths, there are calls for the UK to take more preventative measures to curb the current infection rates. In particular, there are calls for the UK to move to ‘Plan B’.
Plan B includes the use of vaccine passports at higher-risk venues and events, legally mandating masks in certain environments, as well as asking more of the workforce to work from home. Calls for a move to Plan B have been endorsed by a number of senior civil servants, including: i) Prof Peter Openshaw, a member of Nervtag1, who advised putting measures in place now in order to “get transmission rates right down”; & ii) Matthew Taylor, chief executive of the NHS Confederation, who has called for an immediate national move to Plan B (see quote above). Added to that, the Labour Party is also calling on the government to bring in Plan B (Shadow Chancellor Rachel Reeves, for example, on the Andrew Marr show).
In contrast, the government has been warned, in a ‘Treasury Impact Assessment’2, that a five-month move to Plan B would cost the economy £18bn (£800m per week). Furthermore, a Cabinet Office analysis of Plan B concludes that vaccine passports would create only a “moderate impact from reduced community transmission”, and also argues that the steps would disproportionally affect young people, as well as forcing them to migrate to pubs and small venues which may increase the risk of transmission to older and more vulnerable people.
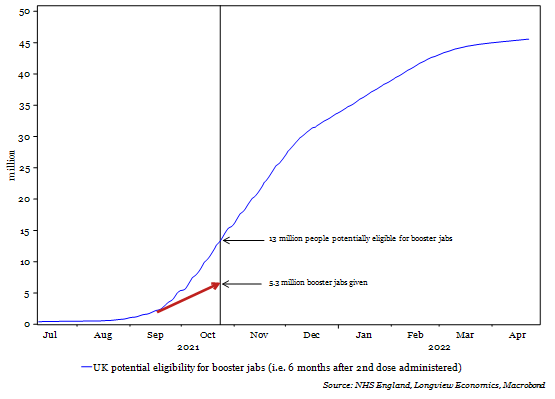
Fig 1b: UK booster jabs given (as of 24th October) and total potential individuals eligible for booster jabs (i.e. 6 months after 2nd dose administered)
So, what happens if the UK government decides not to implement Plan B?
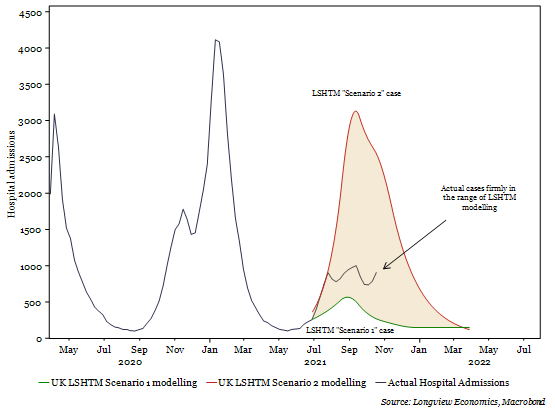
Perhaps somewhat surprisingly, according to some scientific advisory groups, current infection rates, hospitalisations and deaths are set to fall. Indeed, that’s the pattern some have been forecasting throughout the year. The London School of Hygiene and Tropical Medicine (LSHTM), for example, one of the three key contributors to the SAGE SPI-M-O advisory group, predicted on 7th July that hospital admissions would rise sharply to between 1,000 and 5,000 per day, depending on how quickly the economy returned to its baseline ‘openness’. They predicted that admissions would peak in September, before falling to low levels by the end of December. Actual mobility indicators have broadly fallen in the middle, between the conservative ‘Scenario 1’ and aggressive ‘Scenario 2’ framework3 and, with that, actual hospital admissions have also fallen inside the predicted ranges (Fig 1c).
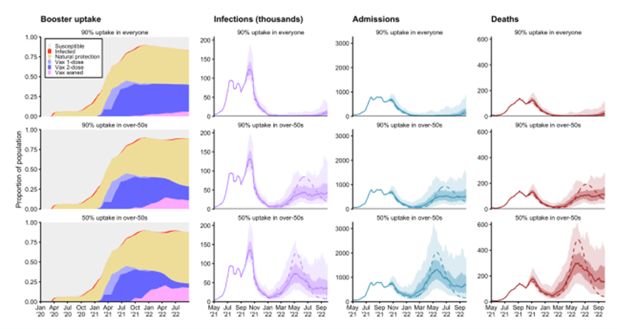
In their more recently published ‘Autumn-Winter Scenarios’4 LSHTM have updated their projections to show a return to minimal infections by January. The path from there remains uncertain and is particularly sensitive to the uptake of the booster jabs (Fig 1d), as well as the continued trajectory of the mobility indicators.
Fig 1c: Actual Weekly Hospital admissions + LSHTM 7th July forecasts5
What is the key driver of the decrease in projected infections? Over the past 4 weeks, over 45% of all positive cases in England have been in under-20s (Fig 1a). According to the ONS Coronavirus Infection Survey, 8.7% of all children aged 11-15 in England currently have the virus. Added to which, we estimate that 17.6% of all 10–19-year-olds have already tested positive (with many more likely to have been positive but not tested6).
Such high infection rates are unsustainable, and likely to fall sharply as a level of herd immunity has been reached. That falloff will be further enhanced by the continued vaccine rollout for children aged 12 and above. This week is also half term in most UK schools and may therefore provide the ‘circuit breaker’ to begin that decline.
Fig 1d: LSHTM forecasts for infections, admissions, and deaths, modelled with various booster uptake rates.
Added to that, the number of daily booster jabs being administered is starting to accelerate. Currently, approximately 300k boosters per day are being administered. Around 7.5 million people have been invited by text, email & letter, according to the National Booking Service.
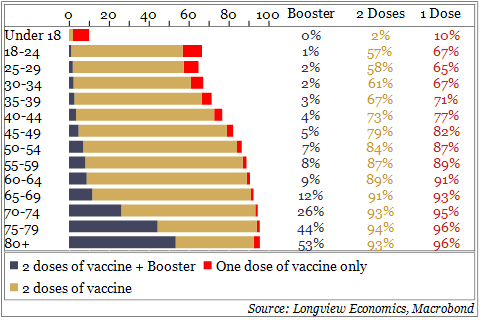
Like the original vaccination program, these are being rolled out to the most vulnerable first (i.e. the most likely to be hospitalised). Over 50% of the over 80s have already been boosted (Fig 1h). Some are claiming this rollout is not fast enough, as the 5.3 million doses is well below the 13 million people currently eligible (i.e., 6 months after their 2nd dose, Fig b).
Should infections fall as predicted this winter, the remaining question is what will come in Spring ’22? As Fig 1d shows, the LSHTM modelling expects cases, hospitalisations, and deaths to rise again from next March. That modelling, though, has much uncertainty embedded within it and its assumptions.
In particular, two key factors will affect the size of the wave next year:
1) The ultimate uptake of the boosters. If 90% of over 50s (i.e. close to 100% of all double-dosed individuals) are further immunised, then total hospitalisations and deaths are likely to remain minimal. A 50% uptake is likely to result in a larger wave than we’re currently in.
2) The vaccine hesitancy in under 50s. The progress towards full vaccination seems to have stalled in all age groups between 20 and 50 (Fig 1g).
Watching those two factors over coming months will therefore be critical (along with booster uptake in other highly vaccinated countries, such as Israel and parts of Europe). For now, though, the calls for a move to ‘plan B’ seem unlikely to be heeded by the UK government, especially if the infections behave as expected over coming weeks.
Fig 1e: New UK confirmed COVID cases (daily, 7-day smoothed)
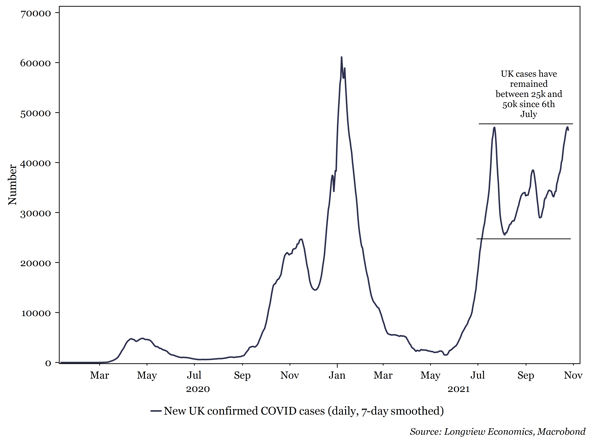
Fig 1f: England positivity rate (% of tests returning positive)
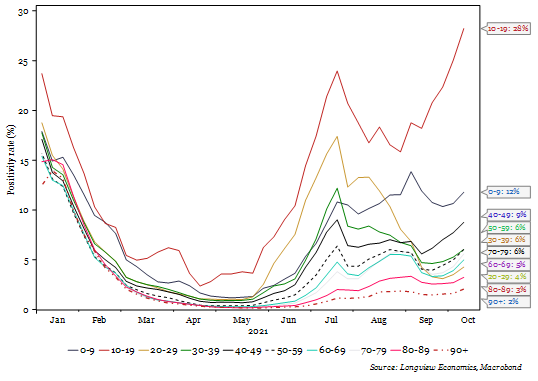
Fig 1g: Percentage of various age groups that are fully vaccinated (2nd dose, %)
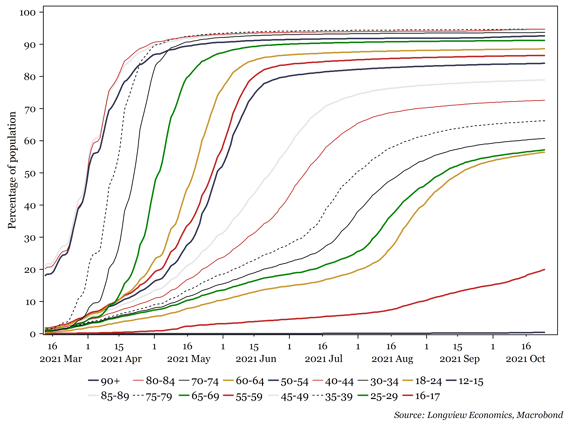
Fig 1h: Percentage of age groups that have received 1 dose, 2 doses & booster (%)