Please find below an extract from our latest COVID-19 Update. For any research enquiries, please contact us at info@longvieweconomics.com.
Concerns over Covid are on the rise once again. In the UK, as the NHS launch their Spring booster jab drive, infections have started rising again, with numerous sources suggesting that another new variant is driving the rise in infections (called ‘BA.2’, e.g. see fig 1k). With several underlying concerns already gripping markets (e.g. the Russia-Ukraine conflict, rising geopolitical tensions, supply shortages, market volatility, etc.), the question is whether another Covid wave will add to that list.
Below, therefore, we dig into the detail of the drivers of the recent rise in UK infections and assess how much it is of concern.
Fig 1: UK case fatality rate1 (%) vs. vaccine doses administered (% of population)
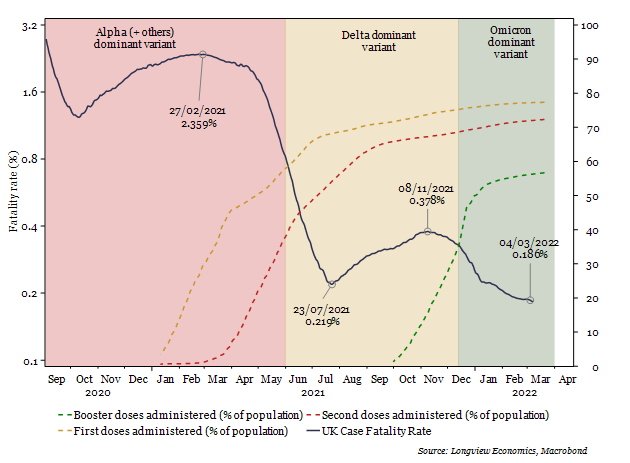
1 ‘Case fatality rate’ = ‘daily deaths’ (100d smoothed, advanced 14 days) DIVIDED BY ‘daily infections’ (100d smoothed). Deaths are advanced to account for the lag between initial infection and death.
Top Level UK Covid Trends
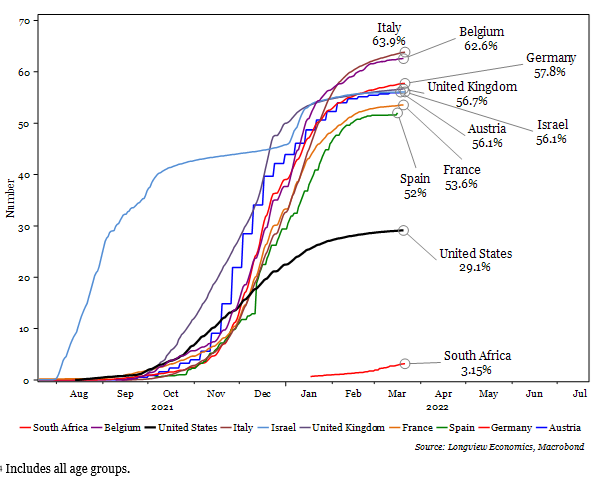
On a top-level basis, there are several reasons to suggest that the rise in infections (both nominally and as a share of total tests taken, see fig 1f) is nothing to be concerned about. In particular, as the temperatures warm up over Spring, it’s likely that infections will recede (i.e. infection rates are high in part because of the recent cold temperatures). Likewise, the impact of Omicron on hospitalisations and deaths have been vastly lower than forecasts made by SAGE and the London School of Hygiene & Tropical Medicine (LSHTM). That has continued despite lower overall booster take-up (relative to the first and second doses) and a slowdown of booster take-up in recent weeks (fig 1l).
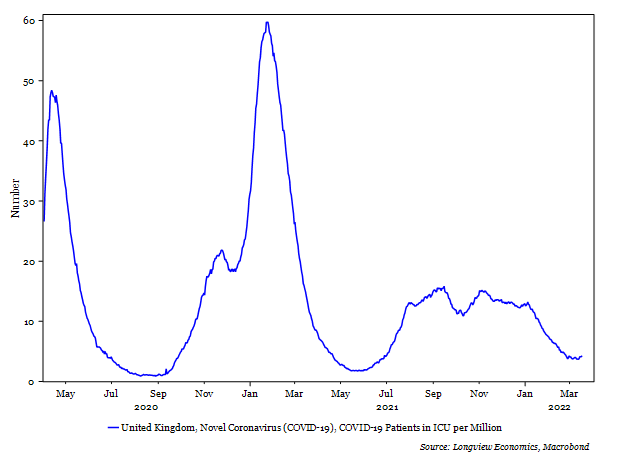
Added to that, while infections have started rising in recent weeks, hospitalisations and deaths remain below previous peaks, albeit hospitalisation rates have turned higher. The number of ventilation beds occupied, ICU beds occupied, and mortality rates also remain close to pandemic lows (e.g. see fig 1b). Indeed, highlighting that, the case fatality rate across the UK is now at its lowest level since the start of the pandemic (reflecting the benign nature of Omicron vs. previous variants, see fig 1).
Fig 1a: Scottish Covid patients in hospital (actual data vs. data adjusted for incidental admissions2)
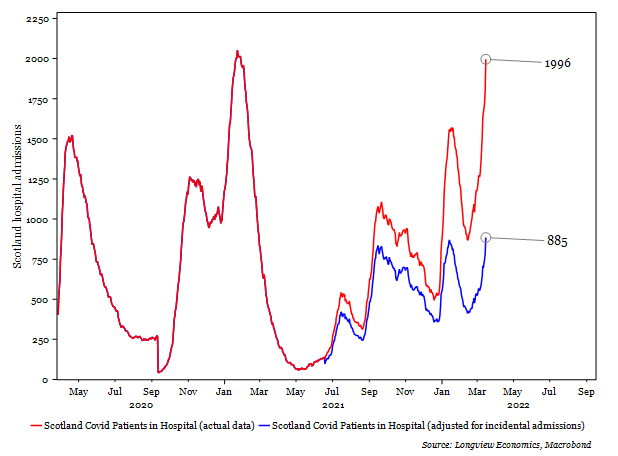
2 NB ‘incidental admissions’ data starts in June 2021
Various other headlines have been causing concerns that this wave could result in a severe bout of hospitalisations or deaths. Some, for example, have pointed out that the number of Scottish Covid patients in hospital has reached a new all-time high (as of the latest data, see fig 1a above). That, though, includes patients who were admitted to hospital for reasons other than Covid. Indeed, the number of patients in hospital with Covid, but not primarily being treated for the virus (in other words, ‘incidental admissions’) now accounts for 56% of total Covid hospital admissions in Scotland (i.e. the highest since June 2021, when the data started to be published, see fig 1g). Accounting for the number of incidental admissions, hospitalisations in Scotland, which are primarily as a result of Covid, remain well below previous highs (see fig 1a).
All of those top-level indicators therefore suggest that Omicron remains relatively benign compared to previous variants. The key question, though, is whether the country wide data is simply hiding some more pernicious regional trends that are yet to emerge at the top level. In order to assess that we have analysed the worst performing regions below.
Fig 1b: UK Covid patients in ICU (per mn population)
The Message of the Troubling UK Regions
Some of the regions of the UK are facing significantly worse trends than the country as a whole. It’s in these parts of the country that we’re able to get a better understanding of how this variant and latest wave of infections is likely to evolve.
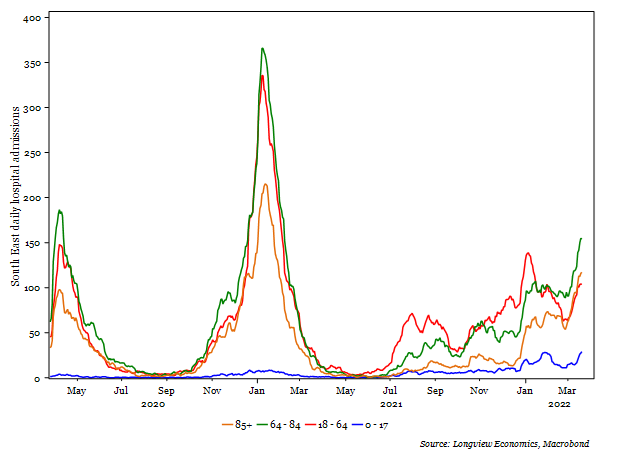
The current rise in infections is predominantly concentrated among the South/Southeast (when adjusted for population size – see fig 1h). Focussing, therefore, on the four key regions in the South (i.e. South East, South West, London, and East of England) we can see that hospital admissions are rising across all age groups (and, in some cases, rates are above their previous Omicron peaks, e.g. see fig 1c & fig 1i below). That therefore suggests that this latest wave of infections (possibly prompted by a new Omicron sub-variant as highlighted above), could result in another sharp wave of hospitalisations. If that begins to overwhelm the health system (especially critical care beds, as in the case of the initial strain and the Delta variant) then the risk of a return to lockdown measures and restrictions will rise.
Fig 1c: UK South East daily hospital admissions by age group
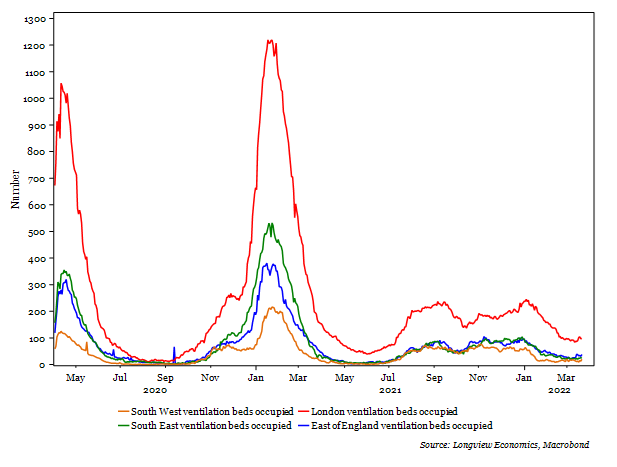
For now, though, the impact of new hospital admissions on the health system is relatively moderate. Indeed, the rise in ‘incidental admissions’ in recent months (to 56% of the total, as of the latest data) shows that hospitalisations due to Covid are well below the reported number. Likewise, the number of ventilation beds occupied by Covid patients in those regions remain close to zero (see fig 1d), whilst the same can be said for the UK’s largest hospitals (e.g. Guys and St Thomas hospital, and St George’s hospital, see fig 1j – all in London). All of that is consistent with the more benign picture painted by the national data, i.e. while infections and hospitalisations are rising, the impact on critical care infrastructure has been limited.
Fig 1d: UK ventilation beds occupied in key Southern regions
 All of that demonstrates that this latest wave of infections has yet to result in significant levels of hospitalisation and mortality. While there are some initial signs that it could be more severe than the previous Omicron wave (i.e. in Dec 2021/Jan 2022), the lack of intensive care required for those new admissions suggests that it’s unlikely to significantly impact the health system (i.e. it’s unlikely to lead to further lockdown measures).
Fig 1e: UK daily infections, hospitalisations, ventilation beds occupied, and deaths (per mn, 7 days smoothed)
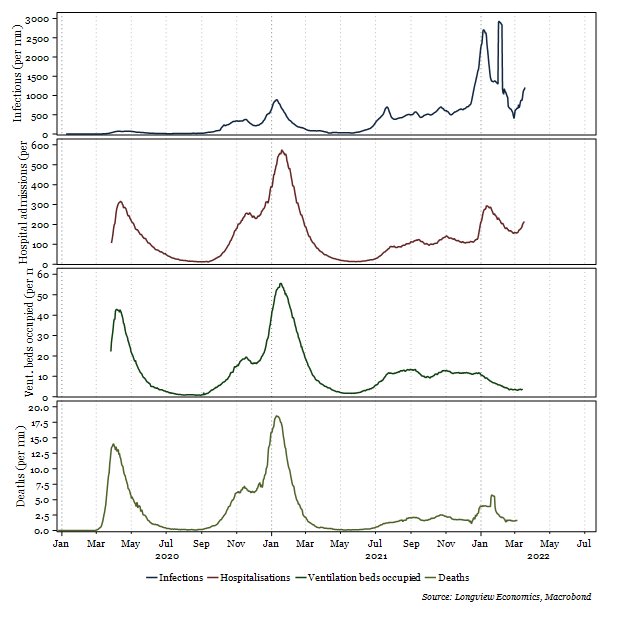
Fig 1f: Share of tests performed that are positive (%, 7 days smoothed)
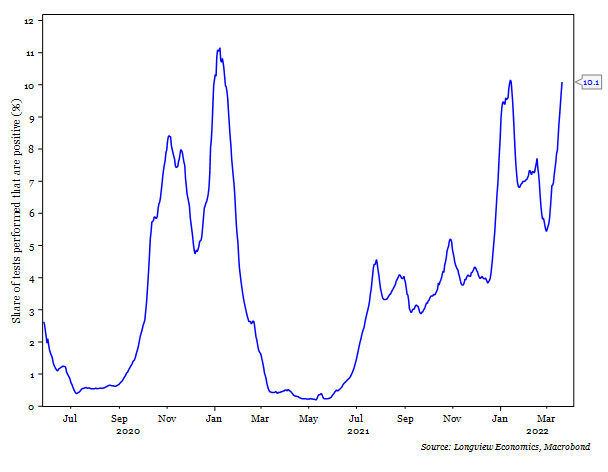 Fig 1g: UK incidental Covid admissions3 (as a % of total Covid hospital admissions)
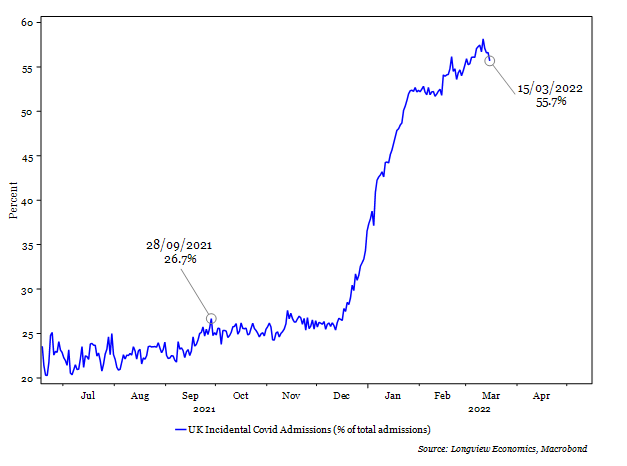
3 ‘Incidental admissions’ = patients admitted to hospital and diagnosed with Covid, yet not being primarily treated for Covid.
Fig 1h: UK regional infections (per mn population)
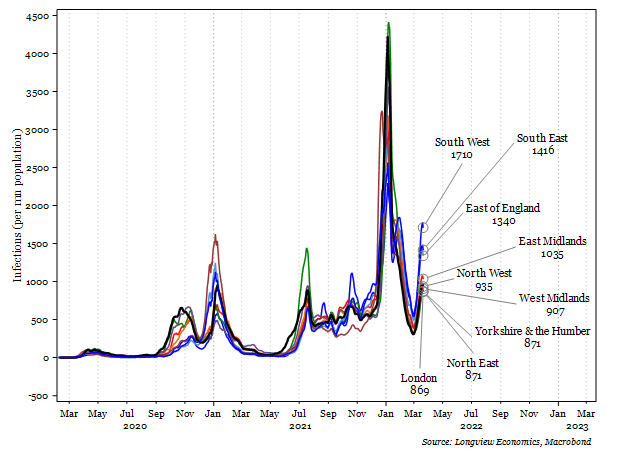 Fig 1i: UK South West daily hospital admissions by age group
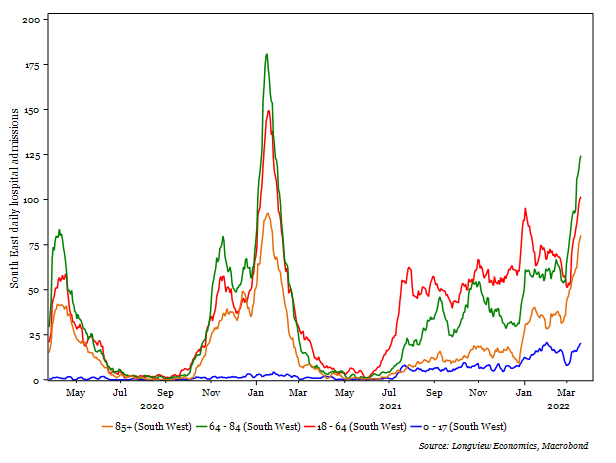
Fig 1j: Medical ventilation beds occupied in Guys’ and St. Thomas’ hospital & St. George’s Hospital
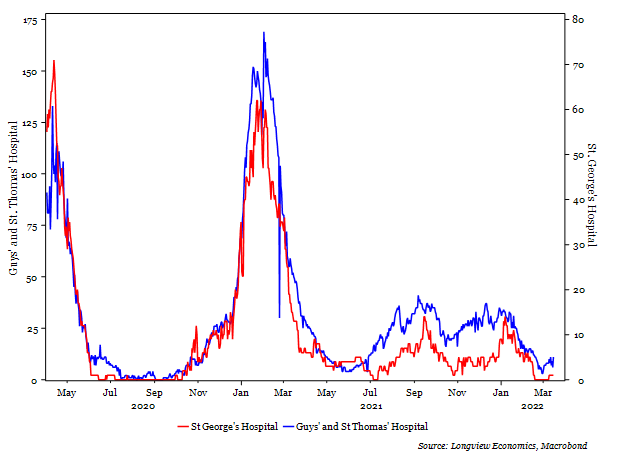
Fig 1k: UK variant infections (as a % of total Covid infections)
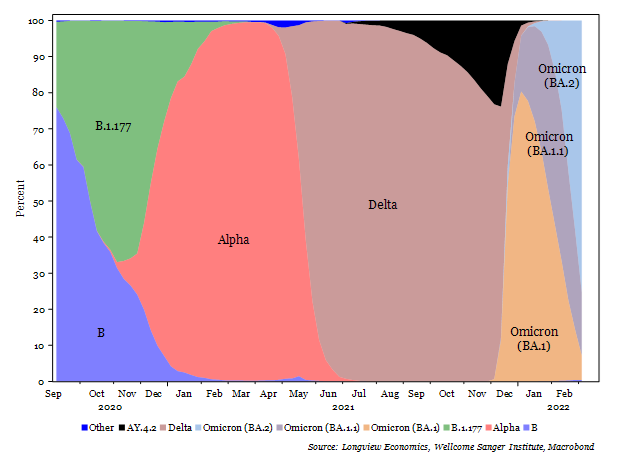
Fig 1l: Share of total population4 boosted (%)