Please find below an extract from our latest Longview on Friday. For any research enquiries, please get in touch at info@longvieweconomics.com.
There is currently plenty of confusion about the outlook for the gold price.
In particular, the traditional set up for a strong gold price is clearly in place: US money supply growth has been significant; inflation is back at its highest level since the early 1980s; and, linked to that, fiat currencies have been meaningfully debased in the past 24 months. Theoretically, in that environment, gold should hold its purchasing power and perform well.
Instead, the price has gone nowhere for the past two years (broadly speaking). It’s therefore not serving as an inflation hedge, nor an ‘alternative’ to fiat money. Furthermore, gold price action is poor: Safe haven buying on the Russian invasion was short-lived and, instead of a breakout above the 2020 high, the price so far looks like it’s made a ‘double top’ (FIG 1).
FIG 1: Gold price (US$/oz), shown with 50, 90, & 200 day moving averages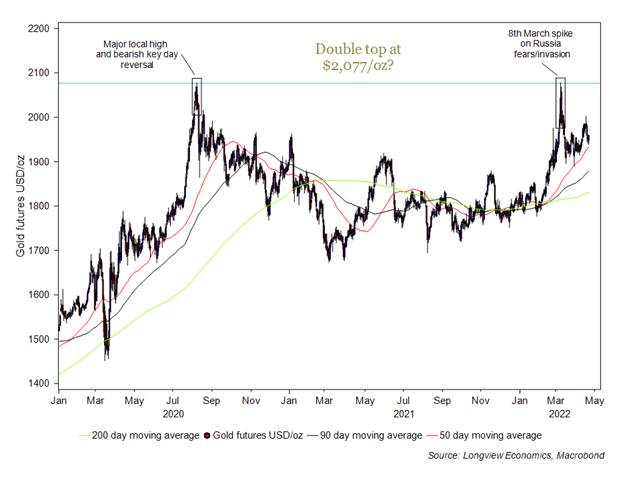
We would argue, though, that gold has been remarkably resilient.
Of note, and while there’s strong evidence that gold is an inflation hedge over long periods of time, short term price direction is determined by other factors.
Those factors relate to the ‘tightness of money’ and include: (i) real interest rates, as measured by the 10 year TIPS yield; (ii) US interest rate expectations (e.g. implied 2 year Fed funds rates); and (iii) the US dollar. Those three factors are the (equally weighted) inputs into our multi-factor model, shown in FIG 2 below.
All three inputs in that model have been negative for the gold price since late last year (higher real rates, more Fed hikes priced in, and a strong dollar). Despite that, gold has rallied – with a somewhat dramatic breakdown in the usual correlation between gold and our multi-factor model (FIG 2). In other words, gold has been remarkably resilient in the face of those key headwinds.
FIG 2: Longview multi factor gold price model vs. gold price (US$/oz)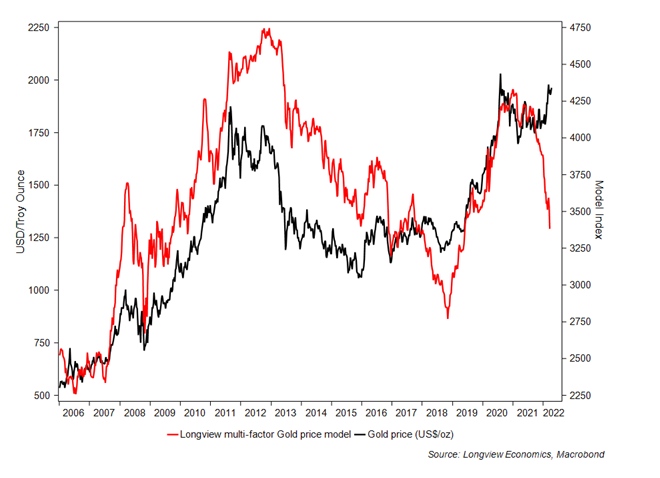
The question therefore becomes: Will the usual correlation re-establish itself? And if so, how will that happen? Is the gold price rally ‘false’, and only driven by flight to safety (given the war in Eastern Europe)? Or, is the gold multi factor model about to start moving higher?
Gold: Are Headwinds about to become Tailwinds?
Our central view is that it’s the latter, i.e. real yields, Fed rate expectations, and the dollar are likely to ‘top out’ and move lower in the near term (over the next few months). If that’s correct, then recent headwinds for the gold price should become tailwinds, with gold likely to break above its key resistance level (i.e. the ‘double top’ high of $2,077/oz).
That view is supported by both (i) the current technical, sentiment, and positioning set up in the dollar and the bonds/rates market; as well as (ii) a number of macro and inflation related factors.
With respect to (i) it’s clear that the narrative around rates (and the dollar) has become largely one way in recent weeks. That’s not surprising given the sustained/strong back up in bond yields. The consensus towards Treasuries, though, is now notably negative, suggesting that the trade has become crowded and the SELL-off is therefore advanced (if not complete). For that reason, we closed our ‘pay 5y dollar rates’ trade this week.
In a similar vein, positioning in the dollar is extreme. Measured sentiment, for example, is back at high/bullish levels…
FIG 3: US dollar sentiment (CONSENSUS Inc. data*) vs. USD index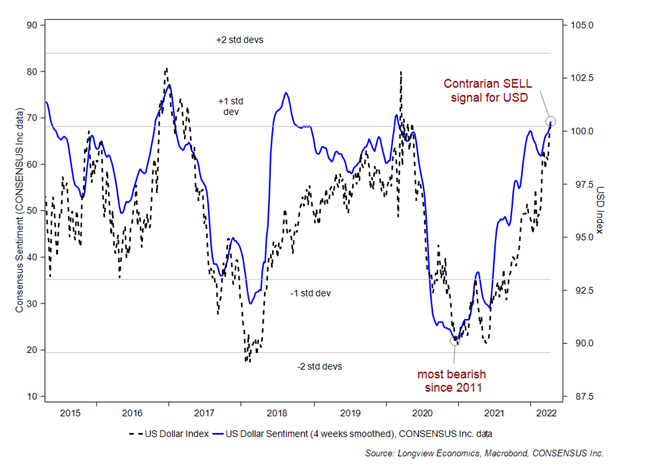
*CONSENSUS Sentiment Index created by CONSENSUS, Inc. and is based on market opinion published by brokerage house analysts and independent advisory services. consensus-inc.com Tel: 816-373-3700.
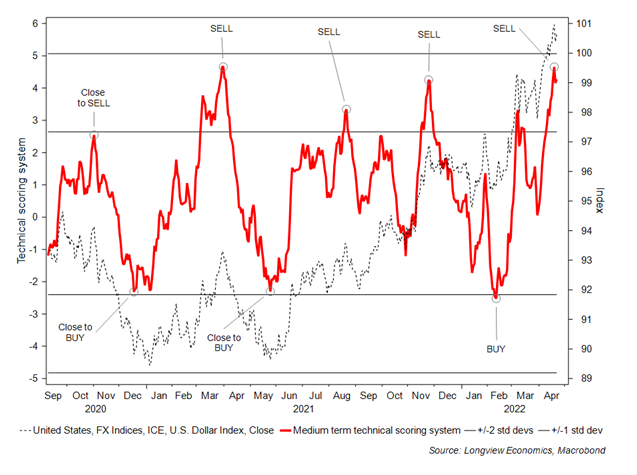
…while technically the dollar is overextended to the upside (FIG 4)….
FIG 4: Medium term technical scoring system for the US dollar vs. USD index
…and positioning remains net LONG and reasonably crowded (FIG 5).
FIG 5: US Dollar Index vs. net speculative LONG/SHORT positions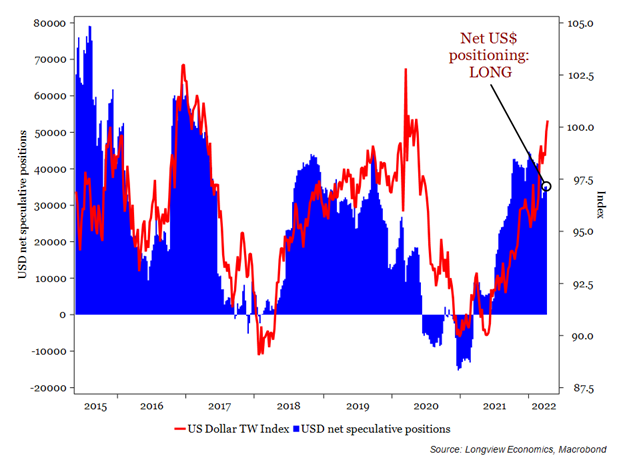
With respect to (ii), and as we’ve highlighted in the past two Longview on Friday publications, inflationary pressures in the US economy have potentially peaked (at least for now).
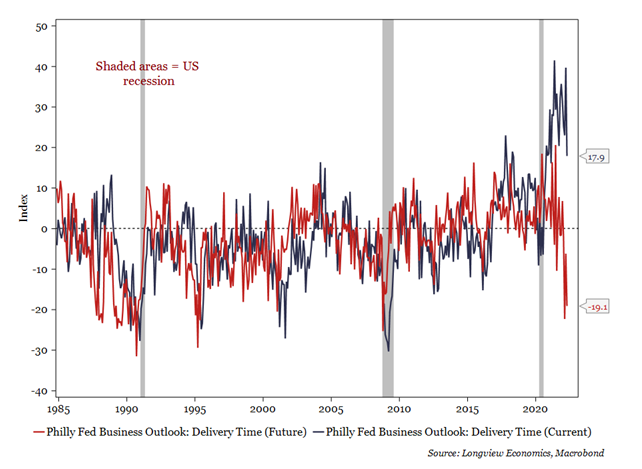
That’s the message of our key inflation models as well as other indicators, including the Atlanta Fed core ‘flexible prices’ (which occasionally leads ‘sticky’ prices). Added to which, base effects are likely to push inflation lower in coming months, while there’s growing evidence that supply chain pressures are continuing to ease (e.g. see yesterday’s Philly Fed supplier delivery index, FIG 6). Linked to all of that, there are growing signs of softness in key cyclically sensitive parts of the US economy (most notably housing and manufacturing – as we examined earlier this week.)
FIG 6: Philly Fed Manufacturing Delivery Times (current vs. future)
We therefore anticipate adding gold exposure in our recommended macro fund in coming days.