The US stock market has hit Twin Peaks in the last week. First the S&P 500 reached the longest bull market in history by some measures (I've already said my piece on why I think this is wrong, but the rally has certainly been going on for a long time). On Friday, the S&P 500 at last closed above its record close from January, set ahead of the sudden return of volatility in February. This is the impressive history of the main US market gauge over the past five years:
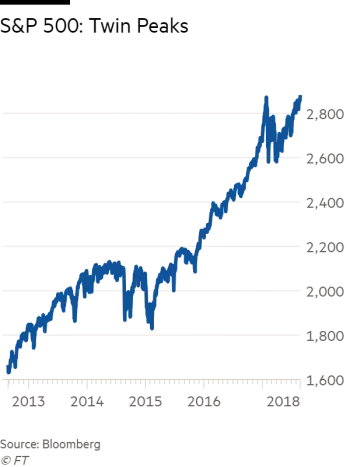
Nobody who has been exposed to the US stock market over the past five years should have much to complain about. As companies have announced a lot of very good news on their earnings and revenues since the previous peak in January, it is also fair to say that stocks are better value now — although it is still highly questionable to say that they are actively good value.
I will not rehearse the arguments about valuation yet again. But what can we make of investors' behaviour, and does it show growing or declining confidence? I have made some of my problems about technical analysis clear in recent months, and received plenty of aggrieved responses, but it makes sense to try to work out how Mr Market is behaving. Trying to turn technical analysis into a hard science is a problem; using it to help what are necessarily subjective judgements about the state of opinion, however, makes some sense.
On this basis, there are two broad reasons for concern. One is that US stocks may be forming a “double top”. This week, Barron's carried the ominous headline: The S&P 500 Might Be Forming a Dreaded ‘Double Top.’ A “double top” pattern is one of the best known signals in technical analysis, and implies that a market will go into a prolonged fall thereafter.
Barron's carried these charts to show that both of the last two big US market breaks were preceded by double tops:
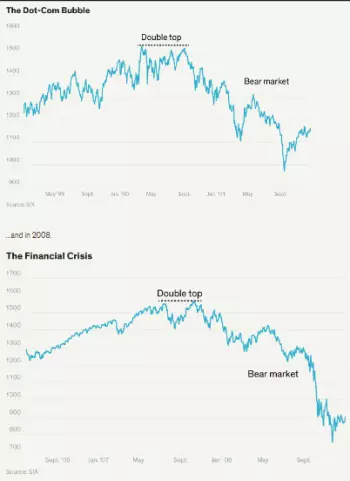
Is what has just happened comparable? The second part of the Barron's headline is more reassuring: Here’s What That Is and Why You Shouldn’t Worry Just Yet. It is certainly unusual for a market to reach a top, correct, and then take as long as seven months to make back its gains. Generally, if you have waited that long, it is because the correction will turn into something worse.
But the science is not hard and fast. The market's high, followed by the China-driven break of 2015, and then a virtual recovery before another sell-off in early 2016, looks a bit like a double top. But it wasn't. Should the market stage an advance in the next few weeks, then we will not have a double top on our hands and there is nothing to worry about. A fall from here would be worrying — it would suggest investors really were uncomfortable trying to take the market to a new high. But so far we cannot say that this is a double top.
Barron's also cited analysts pointing out that the slow and steady recovery of the last few months might suggest that this is a well-supported return of confidence, while another suggested that we need to look at internal measures of market breadth. So there is simply no point in worrying about a double top just yet (although it gave Barron's a good headline, and me an excuse to link to the theme tune from Twin Peaks). The issue of breadth may be more interesting.
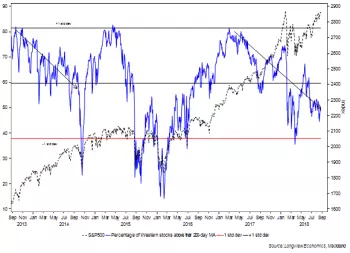
Longview Economics of London published some disquieting analysis of market breadth last week. This shows in blue the percentage of world stocks (from the US, eurozone and Japan) trading above their 200-day moving averages against the S&P 500 itself. The decline in breadth since late 2016 (and the US election) is marked and clear-cut.
It is widely known that the tech sector has been in the lead during the latest leg of the bull market, which also helps to explain why the US stock market has so comprehensively outperformed the rest of the world. But the breadth of the Nasdaq market itself is also narrowing noticeably. Breadth is notably worse than it was at the January top:
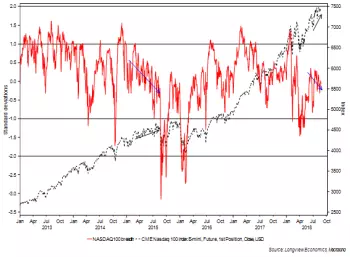
And now look at the correlation of other markets around the world with the S&P 500. This year, that correlation (shown in red) has dropped substantially, and is approaching lows it has not seen since the aftermath of the dotcom Bubble:
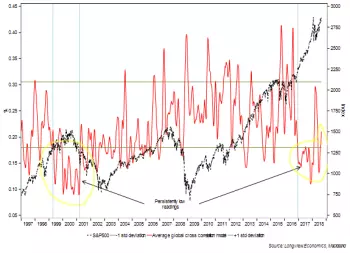
Cynics, like me, will doubtless feel tempted to ask: “So what?” But Longview makes a beautiful defence of the relevance of technical analysis. These models, they say, “are an illustration of the efficiency of financial markets in reflecting the global economic reality”. They point out that as global dollar liquidity tightens (thanks to quantitative tightening, repatriation, and higher US rates), and as China attempts to reduce leverage, so parts of the world economy are slowing down or under pressure. “That deterioration in breadth reflects the deterioration in economics, or more precisely the deterioration in the economic outlook”. The weakest markets are the first parts of the world economy to be hit, such as China, Italy, and some of the most stressed emerging markets. “The more that economic deterioration broadens across the globe, the more breadth deteriorates.”
I find the assessment by Longview very persuasive:
Click here for full article
https://www.ft.com/content/0ceca16c-a96f-11e8-89a1-e5de165fa619#comments-anchor